


Being an investor requires the humility to acknowledge that no one has a crystal ball and we cannot control the future. I find it best to ignore predictions and forecasts and to tune out day to day news, especially from “experts”. It’s just noise that distracts us from our process. There are always Bulls and Bears, so we run the risk of Confirmation Bias, embracing evidence that conforms to our beliefs and disregarding arguments that differ.
The current Bull Market is nine years old and there have been ample reasons for several years to think that we are in the late innings of this expansion. But anyone who has tried to time the market over the past decade has almost certainly hurt their returns rather than enhanced them.
Over the past two weeks, we’ve observed two significant economic signals which like the proverbial “canary in the coal mine” have been strong predictors of past Bear Markets. Because of their rarity and historical significance, I think investors should consider these signals with more weight than opinions, forecasts, or projections.
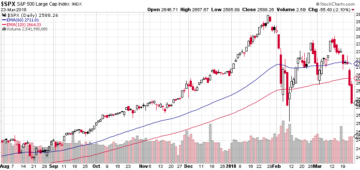
1. The crossover of the Equity Circuit Breaker. We’ve described this technical analysis previously, but here is a quick review: We look at the S&P 500 Index and calculate Moving Averages based on the previous closing prices of the past 60 and 120 days. That is each day, we look back at the previous 60 and 120 days. When the market is in an uptrend, the 60 day moving average stays above the 120 day average and both lines are sloping upwards.
In a Bear Market, a prolonged downturn, the 60 day moving average is below the 120 day average and both are sloping down. The signal occurs when these two lines crossover; this reflects a potential change in regime from an up market to a down market. Because we are looking at longer averages – 60 and 120 days – this analysis usually tunes out brief market panics of a month or two. A crossover occurred this year at the end of November.
This crossover was a good predictor in past Bear Markets; it would have gotten you out of stocks very early in the 2008 crash and back into stocks in the Fall of 2009. However, it can give false positives. Back in 2016, we also had a crossover occur for several months. That year, if you had traded on the crossovers, you would have gotten out at a loss and then had to buy back into stocks several percentage points higher.
2. Yield Curve Inversion. Typically, longer-dated bonds pay higher interest rates than shorter bonds. This week, however, we briefly saw the five-year Treasury Bond trade at a lower yield than the two-year Treasury, an inversion of the normal upwards slope of the yield curve.
Why should you care? A Yield Curve Inversion has been a good predictor of previous recessions. This shows that investors are bidding up five-year bonds, preferring to tie up their money for longer, seeing a lack of short-term opportunities elsewhere. It also reflects a belief that interest rates may fall.
Past Yield Curve Inversions have occurred in 1978, 1988, 1998, 2000, 2005-2006. In each case, except for 1998, a recession took place within a year or two. So it does not have a 100% track record of accuracy either, but it is a rare enough of an event that I think it is worth our very careful consideration. The seven previous recessions all were preceded by a yield curve inversion.
Read More: from Bloomberg, “The US Yield Curve Just Inverted. That’s Huge.”
Over the past several years, when people asked me what it would take for me to become concerned about a Bear Market, I would have told them these two things: a crossover of the moving averages and a yield curve inversion. Both have been good (but not perfect) predictors of past Bear Markets and Recessions. And both have occurred since Thanksgiving this year.
The market may continue to go up in 2019, so I cannot assume anything with certainty. Still, I am concerned enough about these two signals that we are going to be slightly reducing our equity exposure and risk levels for our 2019 models. This is a temporary, tactical move and we will look to move back to our target equity weighting either when we feel that prices are significantly distressed, or after the moving averages have crossed back upwards. We are not going 100% to cash; at this point, we are considering reducing equities by 20%, pending further analysis this week.
We will be making necessary trades on a household by household basis before January 1, making sure we minimize any possible tax liabilities. We will look to harvest losses in taxable accounts and to try to avoid creating gains except in IRAs.
While there’s no guarantee these trades will be profitable, I take these two signals seriously enough that I feel compelled to act and will be doing the same trades in my own portfolio. If we do have a prolonged Bear Market, we may wish to have sold even more. However, I want to balance that risk with the fact that these signals could be wrong this time. Perhaps the market continues up for another year or two before there is a recession and we miss out on significant further gains.
Investors were not at all successful at timing the market back in 2007-2009, even though with the gift of hindsight, we might think it will be “easy” to see and act next time around. My goal remains to create effective, diversified portfolios that are logical, low cost, and tax-efficient. Making tactical adjustments to reduce risk and hopefully enhance returns is what clients expect from me, but we do not make these changes lightly. If you have questions about your portfolio, or want to talk in more detail about these signals, or the economy, I am always happy to have a conversation about what we can do for you.


