The US stock market entered “correction” territory this week, with a decline of 10% from the recent peak on February 19th. Investors are concerned about the impact this will have on their portfolios and retirement plans. In today’s newsletter, we are going to share some facts about market corrections and give three strategies we use to help investors handle the market correction of 2025.
10% drops are common in the stock market. Over the last 125 years, there have been 56 market corrections. Of those 56 corrections, 22 went on to become a “Bear Market”, a drop of 20% or more. On average, we have a market correction every two years and a bear market every five years. It is not unusual for a correction to reverse course fairly quickly. Since 1980, the stock market was higher 12-months after a correction 81% of the time. The average gain, 12-months post-correction, was 13.4%.
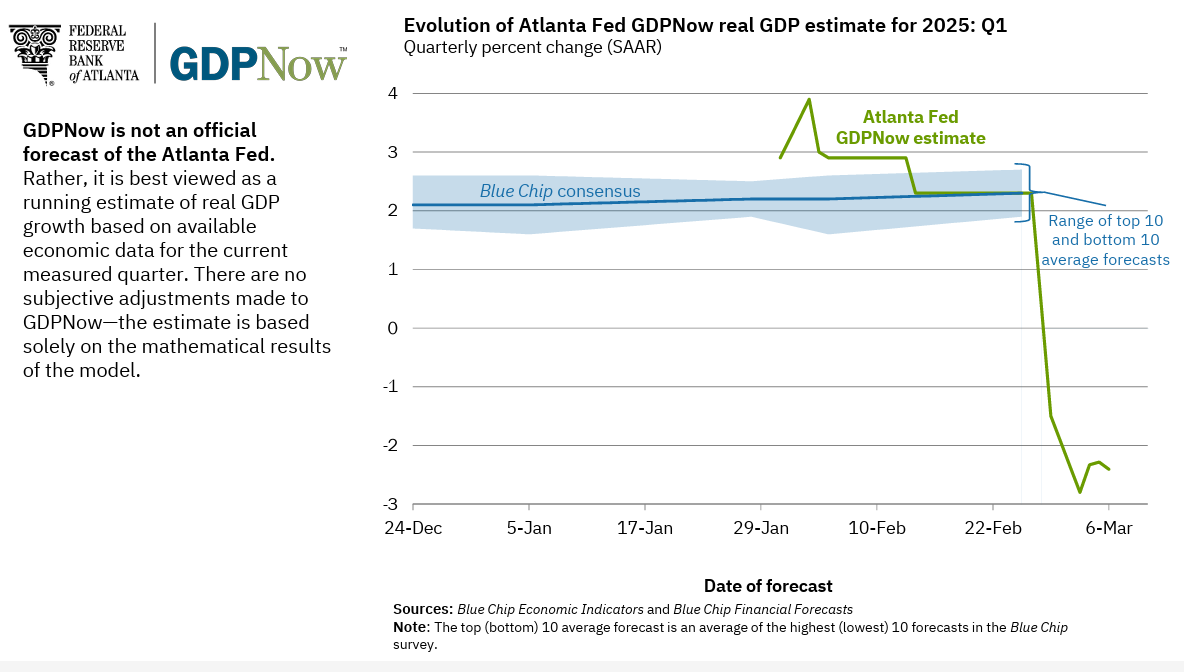
The outlook worsens somewhat if a recession occurs at the same time as a market correction. When this happens, the correction is often longer and more likely to develop into a bear market. The risk of recession has worsened over the past months. The Atlanta Federal Reserve has a statistical model to estimate GDP in real time, called GDPNow. At the end of January, they were projecting Q1 GDP would grow by nearly 3%. By March 6, this estimate has plummeted to -2.4%.
At this point, these are just projections. Still, investors’ appetite for risk decreases greatly when there is uncertainty. Today’s tariff plans, government cuts, and turmoil are certainly factors in the market correction of 2025. And frankly, US stocks had gotten very expensive and were ripe for a pull-back.
Strategies For Market Corrections
Where does this leave investors? Market corrections are a normal part of the investing cycle. Young and middle-aged Investors should do nothing. Don’t sell your funds, and whatever you do, don’t stop Dollar Cost Averaging in your 401(k) or IRA. There have been 21 market corrections since 1980. You should make no effort to “time” the market by trying to predict what you think will happen.
Market Corrections are often a great time to be adding to your diversified portfolio – in hindsight. At the present moment, fear is the more common thought than opportunity. But years from now, March of 2025 may look like an attractive time. (Five years ago, March of 2020 was horrifically painful at the time, but from today’s vantage, looks like an “obvious” opportunity.)
For Investors who are closer to retirement or in retirement, you have less ability to recover from a correction or a bear market. You may have income needs from your portfolio. This is why we advocate having a “Bond Bucket” consisting of individual bonds laddered from 1-5 years. This will provide all the income and withdrawals needed for the next five years, or longer. This allows us to leave our stocks alone during a market correction and not have to sell anything.
If the recent correction has you feeling you are too exposed to risk, what can you do? Here are three ideas:
A. Diversification
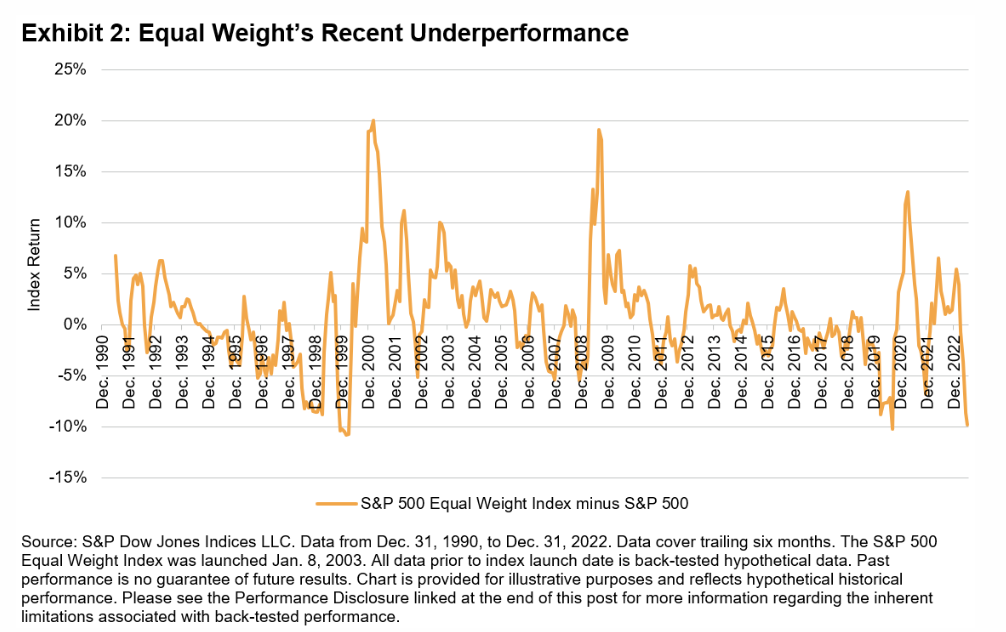
While the S&P 500 is down 4% year to date, International Stocks are up 9%. 5% of that 9% move is from the dollar falling against the Euro. While 2024 was all about US Tech stocks, performance has reversed in 2025. International is doing better than US. Value is now outperforming Growth. Equal Weight Indexes are doing better than Cap Weighted.
Here’s the thing about diversification: we don’t know when it is going to work. In years like 2024, performance is concentrated in a small number of stocks. Investors felt like diversification was hurting their performance, as International lagged US markets. However, these trends are eventually self-correcting. As one category becomes too expensive, another category becomes too cheap to ignore. Investors see International doing well, and sell their US funds and buy the International funds. This selling pressure depresses the US prices and increases the International prices. Remember, stock prices do not equal intrinsic value! Prices go up when there are more buyers than sellers. That’s it.
Our portfolios are highly diversified and the market correction of 2025 is showing why this is an important facet of portfolio construction. The temptation to chase performance often leads to worse results, and we prefer the patient, long-term approach of diversification.
B. Create Income
If you need retirement income from your portfolio, now or in the next couple of years, I suggest creating income from your portfolio. Stocks are highly volatile as we are seeing today. An aggressive portfolio of stocks carries a sequence of returns risk. That means that there is a higher chance of failure in retirement if there is a Bear Market at the beginning of your retirement. Stocks are great for long-term growth, but we don’t buy them for preservation and income.
In addition to the Bond Ladders mentioned above, another tool for retirement income is the Multi-Year Guaranteed Annuity, or MYGA. A MYGA is a fixed annuity, which guarantees you a rate of return for a set period. Today, we can purchase a 5-year MYGA at 5.60%. You can take out your interest monthly (great for retirees) or allow the MYGA to compound and walk away after five years. It’s tax deferred and there are no investment management fees. So, the 5.6% is your net return. MYGAs are non-callable, which is better than most bonds. (And according to several forecasts, 5.6% is higher than the expected return of US stocks for the next decade.)
We bought a lot of MYGAs in 2024 before the market correction of 2025. And I’m very glad we did. It’s not a magic bullet, but for those needing or wanting income, a MYGA is worth a closer look.
C. Index Funds
At every correction or downturn, Investors are tempted by the thought that an Active Fund could be more tactical or could profit from all the volatility in the stock market. It wouldn’t just sit there and do nothing. It could be defensive sometimes or more aggressive at others. It could avoid the loser stocks and stick with the winners.
Unfortunately, the data shows the opposite. Actively managed funds do worse than their benchmark. And the longer you invest the worse active funds do. The Standard and Poors Index Versus Active (SPIVA) report for 2024 was released this month. The study tracks all actively managed funds, including those which closed, for the past 20 years.
In 2024, 65% of Active US Large Cap stock funds did worse than the S&P 500. Over 10 years, that number increases to 84% and at 20 years, 92%. The lesson is clear: active managers do not add value. We are better off using low-cost index funds. If it was possible for mutual funds to time the market or only pick the good stocks, we’d see different results. It is less risky to stick with an Index Fund than to try to select an Active manager who you think will outperform.
Interesting Times
“May you live in interesting times” is a curse referring to times of turmoil and difficulty. Perhaps 2025 will qualify as interesting times. It feels like following the news could become a full-time job and that everything we are seeing is described as “unprecedented”. A lot of people feel overwhelmed and concerned.
Reacting to news, however, can be dangerous for your portfolio. We have a lot of history around market corrections to understand what is going on. They are a frequent, but temporary, interruption to the progress of global growth and productivity.
For investors who want to take additional steps to protect their portfolio, we have three recommendations. Diversify extensively, create income when income is needed, and stick with Index Funds. As unpleasant as market corrections are for investors, they are a natural part of the economic cycle. The key is having a good financial plan in place and then maintaining the resolve and patience to stick with the plan. All of this is very individual to your unique scenario, so please don’t hesitate to email me if you’d like to discuss things further.