Index Funds vs Mutual Funds

Index Funds vs Mutual Funds

Twice a year, Standard and Poors updates their comparison of Index Funds vs Mutual Funds, called SPIVA (S&P Index versus Active report). I have written about SPIVA a number of times, and it is worth repeating, because the data is remarkably consistent.

The majority of actively managed funds do worse than a benchmark or index. The newest report was published today, covering all US Funds through June 30, 2023. When we look at long-term returns, here are the percentage of active mutual funds that performed worse than their benchmark:

Category5-yr10-yr15-yr20-yr
All Domestic Stock Funds89.08%90.19%93.15%93.12%
International Stock81.84%84.78%85.33%92.50%
Emerging Markets70.70%87.56%89.58%92.42%
Source: SPIVA US Mid Year 2023

The evidence comparing index funds versus mutual funds is clear: Index funds are the hands down winner. While past performance is no guarantee of future results, there continues to be overwhelming evidence that index funds do better than the vast majority of active funds over the long-term. And this finding is remarkably consistent, regardless of whether we are in a Bull or Bear market.
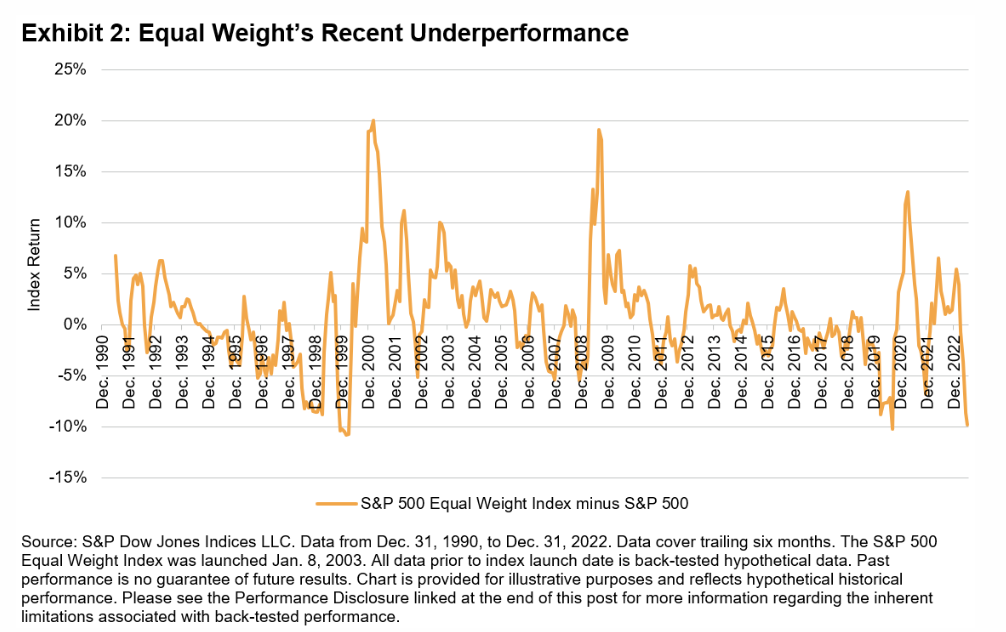
Equal Weight Index

2023 has been a strange year in the market, with narrow breadth of performance. Looking at the S&P 500, performance has been concentrated in a small handful of names, with five large stocks up more than 100% in the first half of the year. So for strategies which didn’t own these high flyers, it was tough to keep up. Value, Small Cap, and other strategies have lagged the Large Caps this year.

But that is likely to reverse, as it has been quite extreme. I’ve written previously about Equal Weight funds, specifically the S&P 500 Equal Weight. It owns the same 500 or so stocks as the S&P 500, but in equal proportion. The standard S&P 500 which weights each stock on its size (“market capitalization”).

Over the very long-term, the Equal Weight strategy (EW) has outperformed. From 1991 through 6/30/2023, the EW S&P 500 index has a return of 11.82% a year, versus 10.55% for the regular S&P 500. That is a noteworthy, long-term improvement in performance, and is typically attributed to the idea that EW has less of the “over-valued” stocks and more of the “under-valued” stocks.

While EW has outperformed over 30+ years, it has not done so consistently or every year. But what is interesting is that when EW has underperformed to an extreme level, it has historically snapped back. And that is where we are today: EW lagged by 9.9% for the first half of 2023. In the chart below from S&P, previous 6-month periods of EW underperformance were followed by periods of strong EW outperformance. The returns have been mean reverting, with EW providing long-term returns in excess of the cap-weighted index

Mean Reversion Ahead?

This would suggest that the outperformance by the Mega-Cap names of the S&P 500 is unlikely to continue. We own some Value and Mid Cap funds which have not kept up with the S&P 500 this year. That can be frustrating and make investors want to pile into those high flying stocks. But the reality is that the outperformance of the biggest stocks versus EW may be overdone. In fact, it is in the 2nd percentile for the first half of the year, more extreme than 98% of previous 6-month periods. Generally, I believe mean reversion is more likely than an extreme trend continuing indefinitely.

We diversify our portfolios broadly and tilt towards areas of better relative value. This has us owning Value funds, multi-factor strategies, small and mid-cap, and Emerging Markets. Why? Our belief in the two topics we discussed today:

  • Passive, index strategies are better than active management over the long-term
  • We count on mean reversion rather than performance chasing

Both of these approaches are well-grounded in research, but require patience and discipline to stay the course. That’s where we are today. And the data reminds us that this still makes sense. The question of Index funds vs mutual funds is just the beginning. There will be ups and downs, which no one can predict or time, so our focus is on having a good investment process and understanding the fundamentals.

Advantages of Equal Weight Investing

The four largest stocks in the United States are all tech companies today: Apple, Microsoft, Amazon, and Facebook. For 2017, these stocks are up significantly more than the overall market, 49%, 38%, 55%, and 52% respectively.

These are undoubtedly great companies, but as a student of the markets, I know you can look at the top companies of previous decades and notice two things. First, top companies don’t stay at the top forever, and second, the market goes through phases where it loves one sector or industry more than it should. (Until it doesn’t…)

And this is the knock on index funds. Because they are weighted by market capitalization, an index will tend to own a great deal of the over-valued companies and very little of the under-valued companies. The top 10 stocks of the S&P 500 Index comprise nearly 20% of its weight today. If you go back to 1999 and look at the valuation of the largest tech companies like Cisco, you can see how those shares were set up for a subsequent period of substantial and prolonged under-performance.

In spite of this supposed flaw in index funds, the fact remains that typically 80% of all actively managed funds perform worse than their benchmark over any period of five years or longer. If the index is hampered by all these over-valued companies, why is it so difficult for fund managers to find the under-valued shares? One possible reason is that the higher expense ratio of an active fund, often one percent or more, eats up the entire value added by the manager.

But there is an interesting alternative to market cap weighting, which avoids over-weighting the expensive stocks. It’s equal weighting. If you have 500 stocks, you invest 0.2% in each company. Your performance then equals that of the average stock, rather than being dependent on the largest companies. To remain equal weight, the fund will have to rebalance positions back to their 0.2% weight from time to time.

There have been extensive studies of the equal weight process, most notably by Standard and Poors which calculates an equal weight version of their S&P 500 Index, and by Rob Arnott, of Research Affiliates, who wrote about equal weighting in various papers and in his 2008 book “The Fundamental Index.”

But even better than studies, there has been an Equal Weight ETF available to investors since April 2003, a 14-year track record through Bull and Bear Markets. The results have been compelling.

– Since inception in 2003, the S&P 500 equal weight fund has had an annual return of 11.21% versus 9.53% for the cap-weighted S&P 500 Index.
– Equal Weight beat Market Cap over 57% of the one-year periods, on a rolling monthly basis since the fund started in 2003. However, the fund out performed over 84% of the five-year periods and 100% of the 10-year periods.
– You might think that by reducing the supposedly over-valued companies, the fund would have lower volatility, but that has not been the case. Instead, the fund has had a slightly higher standard deviation and actually lost more in 2008 than the cap weighted index. It’s no magic bullet; it’s primary benefit appears to be return enhancement rather than risk reduction.

We plan to add an Equal Weight fund to our portfolio models for 2018. Although some of our concern is that today’s tech stocks dominating the index are over-valued, we should point out that there is no guarantee that Equal Weight will be better than the Cap Weighted approach in 2018 or in any given year. However, for investors with a long-term outlook, the approach does appear to offer some benefits in performance and that’s the reason we are adding it to our portfolios.

Before August, the cheapest fund offering an equal weight strategy had an expense ratio of 0.40%. However, there is a new ETF that offers the strategy at an ultra-low cost of only 0.09%, which makes it very competitive with even the cheapest cap weighted ETFs.

If you have any questions on the approach, please feel free to email or call me. For positions in taxable accounts, we have significant gains in many portfolios. In those cases, we will not be selling and creating a taxable event. But we will be purchasing the new fund in IRAs and for purchases going forward.

Source of data: Morningstar.com and from Guggenheim Investments All Things Being Equal dated 9/30/2017.