Long Bonds Beating Stocks in 2019

Through August 31, the S&P 500 Index is up 18.34%, including dividends. Would it surprise you to learn that bonds did even better? The Morningstar US Long Government Bond Index was up 18.40% in the same period. Even with this remarkable stock market performance, you would have done slightly better by buying a 30-year Treasury Bond in January!

How do bonds yielding under 3% give an 18% gain in eight months? Bond prices move inversely to yields, so as yields fall, prices rise. The longer the duration of the bond, the greater impact a change of interest rates has on its price. This year’s unexpected decrease in rates has sent the prices of long bonds soaring. While bonds have made a nice contribution to portfolios this year because of their price increases, today’s yields are not very attractive. And longer dated bonds – those which enjoyed the biggest price increases in 2019 – could eventually suffer equivalent losses if interest rates were to swing the other direction. We find bonds going up 18% to be scary and not something to try to chase. 

Today’s low interest rates are a conundrum for investors. The yields on Treasury bonds, from the shortest T-Bills to 10-year bonds are all below 2%. CDs, Municipal bonds, and investment grade corporate bonds have all seen their yields plummet this year. In some countries, there are bonds with zero or even negative yields.

What can investors do? I am going to give you three considerations before you make any changes and then three ideas for investors who want to aim for higher returns.

1. Don’t bet on interest rates. Don’t try to guess which direction interest rates are going to go next. We prefer short (0-2 year) and intermediate (3-7 year) bonds to minimize the impact that interest rates will have on the price of bonds. With a flat or inverted yield curve today, you are not getting paid any additional yield to take on this interest rate risk. Instead, we take a laddered approach. If you own long bonds which have shot up this year, consider taking some of your profits off the table.

2. Bonds are for safety. The reason why we have a 60/40 portfolio is because a portfolio of 100% stocks would be too risky and volatile for many investors. Bonds provide a way to offset the risk of stocks and provide a smoother trajectory for the portfolio. If this is why you own bonds, then a decrease in yield from 3% to 2% isn’t important. The bonds are there to protect that portion of your money from the next time stocks go down 20 or 30 percent.

3. Real Yields. Many of my clients remember CDs yielding 10 percent or more. But if inflation is running 8%, your purchasing power is actually only growing at 2%. Similarly, if inflation is zero and you are getting a 2% yield, you have the same 2% real rate of return. While yields today are low on any measure, when we consider the impact of inflation, historical yields are a lot less volatile than they may appear. 

Still want to aim for higher returns? We can help. Here are three ideas, depending on how aggressive you want to go.

1. Fixed Annuities. We have 5-year fixed annuities with yields over 3.5%. These are guaranteed for principal and interest. We suggest building a 5-year ladder. These will give you a higher return than Treasuries or CDs, although with a trade-off of limited or no liquidity. If you don’t need 100% of your bonds to be liquid, these can make a lot of sense. Some investors think annuity is a dirty word, and it’s not a magic bullet. But more investors should be using this tool; it is a very effective way to invest in fixed income today. 
Read more: 5-year Annuity Ladder

2. High Yield is getting attractive. Back in 2017, we sold our position in high yield bonds as rising prices created very narrow spreads over investment grade bonds.  Those spreads have widened this year and yields are over 5%. That’s not high by historical standards, but is attractive for today. Don’t trade all your high quality bonds for junk, but adding a small percentage of a diversified high-yield fund to a portfolio can increase yields with a relatively small increase in portfolio volatility.

3. Dividend stocks on sale. While the overall stock market is only down a couple of percent from its all time high in July, I am seeing some US and international blue chip stocks which are down 20 percent or more from their 2018 highs. Some of these companies are selling for a genuinely low price, when we consider profitability, book value, and future earnings potential. And many yield 3-5%, which is double the 1.5% you get on the US 10-year Treasury bond, as of Friday. 

While we don’t have a crystal ball on what the stock market will do next, if I had to choose between owning a 10-year bond to maturity or a basket of companies with a long record of paying dividends, I’d pick the stocks. For investors who want a higher yield and can accept the additional volatility, they may want to shift some money from bonds into quality, dividend stocks. For example, a 60/40 portfolio could be moved to a 70/30 target, using 10% of the bonds to buy value stocks today. 

When central banks cut rates, they want to make bonds unattractive so that investors will buy riskier assets and support those prices. When rates are really low, and being cut, don’t fight the Fed.

Long bonds have had a great performance in 2019 and I know the market is looking for an additional rate cut. But don’t buy long bonds looking for capital appreciation. Trying to bet on the direction of interest rates is an attempt at market timing and investors ability to profit from timing bonds is no better than stocks. If you are concerned how today’s low yields are going to negatively impact your portfolio going forward, then let’s talk through your options and see which might make the most sense for your goals.  

Source of data: Morningstar.com on September 2, 2019.

Will There Be A Recession?

There has been a lot of talk recently about a recession, with concerns about slowing economic growth, the Federal Reserve cutting interest rates, an inverted yield curve, a trade war with China, and so on. A recession is two or more quarters of economic contraction, of negative growth of a country’s economy. Several European countries recently reported one quarter of negative growth and may well be on their way towards a recession this quarter. 

So… will there be a recession in the US? Yes, there will. When? I have no idea.

Please excuse my glib answer. I could put a lot of thought and analysis into the question, but statistically, it’s not predictable with accuracy or certainty. Recessions are an inevitable part of the economic cycle, winter to the summer season of expansion. Unfortunately, unlike December 22, the first day of winter, it is not possible to determine when the first day of a recession will occur. Economists only calculate recessions in hindsight and it would be foolish, and likely even detrimental, for investors to try to change their investments based on today’s recession fears. 

While the US Stock Market made new highs in July, August saw a pullback with increasing worries about a recession. A recession would be negative for investors in the short run, but I think it is very important for investors to stay focused on the long run. The temptation is to think that if we could go to cash before a recession that our returns would be better and we’d avoid losses. As appealing and rational as those thoughts may be, the reality is that attempting to time the market is exceedingly difficult. In my experience, investors who try to time the market rarely do better than those who remain invested and they often would have been better off making no changes.  

Thankfully, I don’t think you need a crystal ball to be a successful investor. Let’s keep a healthy perspective on recessions. Here are some thoughts which may help you to stay invested.

1. If you’re a young investor, contributing monthly to your 401(k) or IRA, and have three or four decades before you retire, you should want a recession! That’s the stock market throwing you a fire sale. You get to buy shares when they are down maybe 20% or more! While Dollar Cost Averaging cannot guarantee a profit, I can tell you that the shares of mutual funds which your colleagues bought in 2008 or 2001 have probably been enormously profitable. If you bought an S&P 500 Index fund 10 years ago, you’d be up about 320% today. 

Recessions have occurred every 5-10 years since 1900. If you are investing for many decades, I wouldn’t be worried about what happens in 2019 or 2020. If the market goes down, keep buying shares of a diversified asset allocation and be glad to buy shares with a very low cost basis.  

Do, however, avoid betting heavily on an individual stock. While the overall stock market has recovered very nicely from previous recessions, there can always be individual companies like Lehman Brothers or Enron, which don’t survive. Those companies may be present in an Index Fund, but if your fund owns 500 or 1000 companies, the impact of one company blowing up is often inconsequential.

2. Think in percentages, not dollars, and study stock market history. A 20%+ drop in the market does occur from time to time, maybe even two or more times a decade. Knowing this, you should be prepared for a drop of this magnitude if you’re in an aggressive allocation. But let’s rephrase this in dollar terms: once you have a $500,000 portfolio, could you stomach a drop of $100,000? That sounds a lot worse than a 20% drop! Of course, when the market goes up 20%, like it did from December 2018 to the highs of July, that would also be a $100,000 gain. 

Seeing performance in dollar terms may feel harsher than looking at performance as percentages which fluctuate greatly from year to year. When you have a big account, you are going to see big swings. This can be difficult to get used to and that’s why I want to look at percentages instead.

If you understand that a market cycle includes up and down years, you will understand that a drop is often only temporary until the market rebounds. If you sell when the market is down and go to cash, you are locking in that loss and eliminating the possibility of participating in a future up cycle. While there’s no guarantee this cycle will always occur in the future, it has been the historical pattern, and I think you have to embrace this tenet of investing if you are to be successful over time. 

3. We build highly diversified portfolios and rebalance. If your target allocation is 60% stocks and 40% bonds (60/40) and the market drops, your weighting to stocks decreases. We will sell some bonds and buy stocks that are down. We have a built-in mechanism to respond to market fluctuations already. Just by maintaining a target allocation and rebalancing, we will be buying stocks when they are on sale and trimming stocks when they have run up. That won’t prevent a loss when the market does drop, but rebalancing can help to potentially smooth returns and maintain your target level of risk for your portfolio.

4. Investors who are getting closer to retirement undoubtedly feel the most pressure about near-term performance. In part, this is due to an oversimplification of the retirement planning process, by using something like the “4% rule”. Then, if your portfolio drops 20% in the year before retirement, it would appear to be devastating. If you were expecting $40,000 a year in income from a $1 million portfolio, a drop to $800,000 would reduce your 4% withdrawal rate to just $32,000 a year. 

That’s why we should be careful about using a “rule of thumb” approach as being the ultimate guide in retirement planning. For someone who is 65 and healthy, we should be planning for a 20-30 year time horizon, not for the next 1-2 years. As retirements become longer, it is a reality that you are going to experience multiple recessions. Looking at a retirement date of 1-3 years away does not mean that you automatically have a short-term investment horizon. We need to think long-term and have a plan that isn’t going to be derailed by performance in the last year or two before retirement. 

5. If you’re retired and taking 4% withdrawals, consider this: The dividends in our US stock market ETFs are around 2% and higher for our foreign ETFs, often in the 3% range. Even with today’s low interest rates, your bonds are overall yielding 2% or more. Regardless of your allocation, you’ve already covered at least half of your annual 4% withdrawals from stock dividends and bond interest. In terms of sales, you might be dipping into principal by only 2% a year or less. If the market is down for a year or two, you’re not going to run out of money. For my clients who are taking distributions, we set dividends and interest to pay out in cash and I generally only have to sell a small number of shares once a year.

I’m not looking forward to a recession or a Bear Market, but I’m not really all that worried either. Knowing that recessions are a natural part of the economic cycle doesn’t make them any less painful, but if you can step back and take a longer-term view, you will be more comfortable with accepting that being an investor requires patience, perseverance, and a positive attitude.  We’ve built our portfolios for all environments, but that doesn’t mean that risk can be avoided or eliminated. Rather, we can choose how much risk we take and to avoid unnecessary risks of being overweight one stock, sector/country funds, or being undiversified. Whether you are a new investor or a retiree, I don’t want you to make knee-jerk reactions because of talk about a future recession. Recession talk may play well on cable news, but it’s not a useful input for long-term investment success. 

10 Rules for Playing Defense in Investing

Stocks take the stairs up and the elevator down. When they rise, it is slow and steady, but when they go down it feels like a free-fall. Given the recent market tumult, I wanted to share my top ten rules for defensive investing.
Defense doesn’t mean that you won’t have losses on days when the market goes down. It means that you avoid unnecessary risks that could really blow up your portfolio, so you can have the confidence to stay with the plan.

1. Diversification is the only free lunch in investing. You should be diversified by company, as well as by sector and country. If your employer issues you stock options or has an Employee Stock Purchase Plan, take every opportunity to sell and diversify elsewhere. Most disaster stories I hear are from people who failed to diversify.

2. Index Funds are the antidote to performance chasing. When you pick a concentrated fund, such as a sector fund or single country fund because of its recent track record, you risk buying at the top and experiencing a painful (and much larger than necessary) drop when the winds change direction. While it’s so easy to find actively managed funds that beat the index over the past year, there is a better than 80% chance that those funds will lag the index over the next five or more years. The Index fund is also likely a fraction of the cost and is also more tax-efficient than an actively managed fund.

Read More: Manager Risk: Avoidable and Unnecessary

3. Asset Allocation is the most important decision you make. Start with a carefully measured recipe so you don’t end up with a random collection of funds and stocks you’ve acquired over the years. If you’ve decided that a 60/40 portfolio is the right mix for your needs, that should be for all market environments, not just while stocks are going up.

4. You are going to be tempted to adjust your Asset Allocation. It is very tough to get this right, because humans are wired to make terrible investing decisions. We want to sell a down market and we want to buy when the market is at all-time highs. Obviously, in hindsight, we should buy when things are really ugly and sell at the peaks. Invest with your brain and not your gut-feeling.

Read More: Are You Making These 6 Market Timing Mistakes

5. Rebalance. When you have a target asset allocation, then the process of rebalancing back to your target levels creates a built-in process of selling assets which have shot up in value and buying assets which have temporarily gone out of favor. This works great with Funds, but don’t try this will individual stocks.

6. We buy stocks for growth and bonds for income and safety. When you try to switch those objectives, things seldom go as planned or hoped. Buying stocks for their yield and safety can easily lead to long-term under performance. Many times you will be better off in a plain vanilla index fund than a basket of super-high dividend stocks or supposedly safe stocks. Many high-yielding stocks are very low quality companies with no growth. When they do eventually cut their dividends, the shares plummet.

Similarly, you can find bonds that as quoted, should yield stock-like returns. Stay away. These could be future bankruptcies.

Read More: Bonds for Safety in 2019

7. Don’t use margin. Keep cash on hand. If you don’t thoroughly understand options, avoid them. Don’t buy penny stocks or stocks on the pink sheets.

8. Dollar Cost Average in every account you can. 401(k) accounts are ideal. You will often make most of your gains on the shares you purchased in a down market, you just won’t know it until later. 

9. Take your losses. Don’t play the imaginary game of “I will sell it when it gets back to even”. If you are in a crummy fund, replace it with a more appropriate fund. We tax-loss harvest in taxable accounts annually and immediately replace each sale with a different fund in the same category (large cap value, emerging markets, etc.). 

Read More: Why You Should Harvest Losses Annually

10. Stick to the Plan. Don’t make abrupt, knee-jerk changes. Investing adjustments should not be all in/all out decisions. Keep opening your statements, but recognize that a bad day, month, quarter, or year doesn’t mean that anything is wrong with your plan. Of course, if you didn’t start with a plan, that’s another story.

We genuinely believe that no one can repeatedly time the market and that the attempts to do create significant risk to your long-term returns. I try to convey this message consistently. Last week, a friend asked if all my clients were panicking about that day’s drop. And I said that I hadn’t gotten a single call that day, because they know we are in it for the long haul and have already positioned their portfolio with their goals in mind. 

It will not surprise you that I think you are more likely to be a successful investor if you work with an advisor who can make sure you start with a plan, stick to an asset allocation, and implement your plan with sensible investments. Along the way, we will rebalance, make adjustments, and monitor your progress. We are looking to help more investors in 2019 and would welcome an opportunity to discuss how our approach could work for you. 

A Bond Primer

We have been adding individual bonds and CDs across many accounts since December, as we looked to reduce our equity exposure and take advantage of higher yields now available in short-term, investment grade fixed income. When you are an owner of individual bonds, you are likely to encounter some terminology that may be new, even if you’ve been investing in bond funds for many years. Here are some important things to know:

Bonds are generally priced in $1,000 increments. One bond will mature at $1,000. However, instead of quoting bond prices in actual dollars, we basically use percentages. A bond priced at 100 (note, no dollar sign or percentage symbol is used) would cost $1,000. 100 is called its Par value. If you are buying newly issued bonds, they are generally issued at Par (100). This is called the Primary Market – where issuers directly sell their bonds to the public. We also buy bonds in the Secondary Market, which is where bond desks trade existing bonds between each other. 

In the Secondary Market, bond prices are set by market participants. A bond priced at 98.50 would cost $985, and would be said to be at a discount to Par. A bond priced at 102 would cost $1,020, called a premium. As interest rates rise, the value of existing (lower yielding bonds) will fall. There is an inverse relationship between price and interest rates – when one rises, the other falls.

Bonds have a set Maturity date. That is when the issuer will return the $1,000 they borrowed from the bondholder and cancel the debt. Some bonds are also Callable, which means that the issuer has the right to buy the bond back before its maturity date. This benefits the company, but not the bondholder, because when interest rates are low, companies can refinance their debt to a lower rate.

Most bonds pay interest semi-annually (twice a year). We call this the Coupon. A bond with a 4% coupon would pay $20 in interest, twice a year. If the bond is priced exactly at Par, then the coupon is the same as the effective yield. However, if the bond is priced differently, we are more interested in its Yield to Maturity, commonly listed as YTM. This is very helpful for comparing bonds with different coupons. 

Most bonds pay a fixed coupon, although some pay a step coupon, which rises over time, and others are floating, tied to an interest rate index, or inflation. When we purchase a bond between interest payments, the buyer will receive all of the next payment, so the buyer will also pay the seller Accrued Interest, which is the interest they have earned calculated to the day of sale.

For bonds which are callable, we also have the Yield to Call (YTC), which measures what your yield would be if the bond is called early. Generally, if we are buying a bond at a discount, Yield to Call is attractive. If we buy at 96 and they redeem at 100, that’s a good thing. But if we buy a bond at a premium, we need to carefully examine if or when it might be callable. Yield to Worst (YTW) will show the worst possible return, whether that is to maturity or to a specific call date. 

Some bonds do not pay a coupon and are called Zero Coupon Bonds. Instead, they are issued at a discount and grow to 100 at maturity. Treasury Bills are the most common type of zero coupon bonds. US Government Bonds include Treasury Bills (under one year), Treasury Notes (1 to 10 years), and Treasury Bonds (10 to 30 years). There also are Treasury Inflation Protected Securities (TIPS), which are tied to the Consumer Price Index, and Agency Bonds, which are issued by government sponsored entities, such as Fannie Mae or Freddie Mac.

In addition to Government Bonds, we also buy Corporate Bonds – those issued by public and private companies, Municipal Bonds issued by state and local governments, including school districts, and Certificates of Deposit (CDs) from Banks. 

Most Municipal Bonds are tax exempt, at the Federal and possibly at the state level. If you live in New York, any Municipal Bond would be tax-free at the Federal Level, but only NY bonds would be tax-free for NY state income tax. In states with no income tax, such as Texas, a tax-exempt bond from any state will be tax-free for Federal Income Tax purposes. 

To make their bonds more attractive, some municipal bonds are Insured, which means that if they were to default, a private insurance company would make investors whole. Those municipal insurers got in trouble in the previous financial crisis, and some are still weak today. My preferred insurer is Assured Guaranty (AGMC).

Please note that some Municipal Bonds are taxable; we sometimes buy these for retirement accounts. In addition to the types of bonds we’ve discussed, there are thousands of bonds issued outside of the US, in other currencies, but we do not purchase those bonds directly. 

There are several agencies that provide credit ratings to assess the financial strength of the issuer. Standard and Poor’s highest rating is AAA, followed by AA+, AA, AA-, A+, A, A-, BBB+, BBB, BBB-. These are considered all Investment Grade. Below this level, from BB+ to C are below Investment Grade, often called High Yield or Junk Bonds. D means a bond has Defaulted. Moody’s ratings scale is slightly different: Aaa is the highest, followed by Aa1, Aa2, Aa3, A1, A2, A3, Baa1, Baa2, and Baa3 for Investment Grade. Junk Bonds include Ba(1,2,3), B(1,2,3), Caa(1,2,3), Ca, and C.

There are about 5,000 stocks issued in the US, but there are probably over a million individual bonds issued, each one identified by a unique CUSIP number. Every week, there are bonds which mature and new ones which are issued. 

Our approach for individual bonds is to buy only investment grade bonds, and ladder them from one to five years with diversified issuers. We also sometimes invest in other types of bonds, such as floating rate bonds, mortgage backed securities, emerging markets debt, or high yield. For those categories, we will use a fund or ETF because it’s more important to diversify very broadly with lower credit quality.  

Bonds for Safety in 2019

2018 saw rising interest rates, which hurt the prices of bonds. Most bond funds were flat to slightly down for the year. Rising interest rates also means higher yields, and we now see sufficient yields to justify buying short-term bonds. We have been reducing our equity exposure over the last few weeks, and have been using those proceeds to buy individual investment grade short-term bonds and Exchange Traded Funds (ETFs). 

I wanted to share a couple of themes which will guide our investment process for fixed income in the year ahead. In general, this is not a great time to be taking a lot of risk with your bond allocation. We want to use bonds to offset the risk of stocks to dampen overall portfolio volatility. Thankfully, bonds can now also make a positive contribution to your return albeit in a very modest 2-4% range, and with low or very low risk.

1. Credit doesn’t pay. A credit spread measures the difference in yield between a high quality bond, such as a US Treasury bond, versus say a bond issued by a company which has lower credit. That spread remains very tight today, meaning that you are not getting much additional yield for accepting the credit risk of a lower quality issuer.

This has led us to be selective about which corporate bonds we buy, only buying issues which have enough spread to justify their purchase. In today’s market, this primarily leads us to financial companies, especially the large banks, and to municipal bonds, including the rarely-discussed taxable municipal bonds which are a good choice for IRAs or other non-taxable accounts.

Both Treasury and US Government Agency bonds still have lower yields than CDs. This month, we bought some one-year CDs at 2.70% to 2.75% while the one-year Treasury was around 2.50%. That spread widens as we look to two and three year maturities.

I should explain that we offer “Brokerage CDs”, which are a little different than your typical bank CDs. Brokerage CDs are FDIC-insured against loss and we can shop for the best rates available, from both top banks like Wells Fargo or JP Morgan Chase and from smaller local banks who want to compete for the best yield. 

While you can typically redeem a bank CD early, albeit with an interest penalty of a few months, with a Brokerage CD, you would have to sell the CD in the bond market. If interest rates continue to rise, you would likely have to sell at less than full value. While these CDs offer the excellent rates, they are best used when you can hold to maturity.

We use CD rates as the basis of our spread comparison, rather than the traditional Treasury bonds. If we can’t find an improvement of at least 0.35% to 0.50% for an A-rated bond, then it’s not worth taking even the small risk over the CD. We will still use Treasury Bills for maturities of 6 months or less.

2. 5-year Ladder. In larger accounts, our goal is to create a ladder of bonds and CDs that mature over the following five years (2019, 2020, 2021, 2022, and 2023). This gives us a nice diversification of maturities while still maintaining a low overall duration. When the 2019 bonds mature, we purchase 2024 bonds to maintain a 5-year structure. In a rising rate environment, we are likely to be able buy new bonds at a higher rate. 

Besides being a sensible way to build a bond portfolio, a ladder also can be used to meet future needs for withdrawals or Required Minimum Distributions. Then instead of needing to sell equities or bond funds which could be down, we have a bond that is maturing to meet those cash needs. As a result, an investor might not need to touch their equities for the next five years. If or when their equities do grow, we can rebalance by selling stocks and buying new bonds at the top of the ladder.

While bond prices may go down if interest rates continue to rise in 2019, when you have an individual bond or CD, you know that it will mature at its full face value. So even if prices fluctuate, you will realize your stated Yield to Maturity when you do hold to maturity, which should be very possible with a 5-year ladder.

(Two notes: 1. While we can say that CDs and Treasury Bonds are guaranteed, other types of bonds do have some risk of default and cannot be described as guaranteed. 2. Investors who try to predict interest rates have as little success as investors who try to predict stock markets. We do not want to make bets on the direction of interest rates.)

3. Fixed Annuities. Annuities get a bad rap, but a Fixed Annuity is a third type of guaranteed fixed income investment. They deserve a closer look by investors as a bond substitute and work well with a 5-year laddered approach.

The current rate for a 5-year fixed annuity is 3.80% from one carrier I use. That compares to a 5-year CD at 3.35% to 3.60%. That’s not much of an improvement, however, the Fixed Annuity is an insurance product outside of our managed portfolio, so there are no investment management fees. Your net return is 3.80%. The insurance company will pay me a small commission directly, which does not impact your principal or your rate of return.

I think laddering fixed annuities can make sense for some, as a bond replacement, and more investors should learn about this before dismissing it as soon as they hear the word annuity. A 3.80% percent return on an annuity would be the equivalent of a 4.80% bond if you include a 1% annual management fee.

We wrote about doing a 5-year ladder of Fixed Annuities back in February 2016 in this blog, and I think it still makes sense for some investors. We would count this as part of your fixed income target for your overall portfolio allocation (60/40, etc.).

The stock market gets a lot of attention, but we don’t neglect fixed income in our portfolios. I do think there are benefits to managing your bond portfolio, and we spend as much time sweating the details of our fixed income selections as we do our stock market exposures.

The Persistence Scorecard

As investors begin reviewing their year-end 2018 statements for their 401(k) and other accounts, I know many will want to change funds after a disappointing year. What do investors do? If they have 15 funds available in their plan, they will often sell out of their lagging fund and put money into whichever funds are performing best.

It seems rational enough to believe that a fund manager who is doing well might have above average skills, work harder, or have a better team than other fund managers. That’s why many investors switch funds – in the assumption that an excellent track record is evidence that strong performance will continue. 

You should care about your funds and their managers. But the reality is that switching funds for better performance is not a slam dunk. In December, Standard and Poor’s released their semi-annual Persistence Scorecard. I hope you will read this report. It may change how you invest, how you select funds, and the reasons why you would switch from one fund to another.

In the Scorecard, S&P analyzes returns of over 2,000 US mutual funds, to determine whether high performing funds continue to have strong performance. They evaluate funds by quartile, with data through September 30, 2018. The top 25% of funds would be called first quartile and the worst 25% of funds would be the fourth quartile.

When you buy a fund in the top quartile, what is the likelihood that it will stay a top performer? Let’s go back to September 2016 and track the 550 domestic equity funds that were in the top 25% for the preceding one-year period. Only 21.09% of the top quartile funds stayed in the top quartile in the next year, ending September 2017. And only 7.09% of the 2016 top quartile funds managed to stay in the top quartile for both 2017 and 2018. Of the funds in the top 25% in 2016, only one in thirteen would stay in the top quarter for the next two years.

When you buy this year’s top funds, it is very unlikely that those funds will continue to be the best performers in the subsequent years. Even though we have all heard that “past performance is no guarantee of future results”, everyone still wants to buy the 5-Star fund, even though all that rating tells us is the fund’s most recent performance!

Perhaps you knew better than to put much weight on one year performance. Still, wouldn’t a good manager be able to create a nice long-term track record? The Scorecard also looks at three and five-year returns.

Let’s consider the five-year data:

We will go back to September 2013 and track the 497 funds which were in the top quartile for five-year performance. How did they do over they following five years, through September 2018?

Only 27.16% would stay in the top quartile for another five years. 21.73% would fall to the second quartile, 20.32% would fall to the third quartile, and 21.13% would end up in the bottom quartile. Additionally, 9.46% of the top funds in 2013 would not even exist five years later. Fund companies merge or liquidate their worst performing funds to make their track records disappear. That’s right, when you go on Morningstar and look up funds, what you see is the result of Survivorship Bias. The record has been cleansed of the worst offenders and you only see the survivors. Thankfully, S&P keeps all data and includes deleted funds in its study.

To me this is another reason to use index funds rather than active managers. There is little evidence that when you pick a top performing manager that he or she will persist as a top performer. In fact, there is about only a one-in-four chance a top fund will remain in the top quartile. That’s pretty much a roll of the dice. Switching from one active manager who is underperforming to another active manager who was recently outperforming is very unlikely to be a successful strategy.

Instead of focusing on manager selection and risk chasing performance, we take a more structured approach:

1. Start with the overall asset allocation. Your weighting of stocks and bonds (60/40, 70/30, 50/50, etc.) is the largest determinant of your portfolio risk and return in the long run.

2. Determine how much you want in each category, such as US Large Cap, US Small Cap, US Value, International, Emerging Markets, etc. We base this on correlation, risk and return profiles, and diversification benefits. Then, we adjust the weightings towards categories which we feel are presently undervalued relative to the others.

3. Choose funds which closely reflect those categories. If you are buying a mid-cap fund, it should act like a mid-cap fund. 

4. Expenses matter. According to research from Morningstar: “the expense ratio is the most proven predictor of future fund returns.” We prefer funds with low expenses so you can keep more of the performance you are buying.

5. While we could use actively managed funds, we like the track record of index ETFs, along with their low cost, tax efficiency, and transparency. They are great building blocks for a portfolio.

Being diversified means owning a broad basket of holdings. This can be frustrating sometimes, wondering why you own A instead of B, when A is down this year and B is up. But putting all your money into whichever category or fund is doing best at any one point in time is not an effective strategy. That’s not just my opinion – look at the data from Standard and Poor’s Persistence Scorecard and I think you will reach the same conclusion. Bet on the market, not the manager.

Storm Clouds Gathering

Being an investor requires the humility to acknowledge that no one has a crystal ball and we cannot control the future. I find it best to ignore predictions and forecasts and to tune out day to day news, especially from “experts”. It’s just noise that distracts us from our process. There are always Bulls and Bears, so we run the risk of Confirmation Bias, embracing evidence that conforms to our beliefs and disregarding arguments that differ.

The current Bull Market is nine years old and there have been ample reasons for several years to think that we are in the late innings of this expansion. But anyone who has tried to time the market over the past decade has almost certainly hurt their returns rather than enhanced them.
Over the past two weeks, we’ve observed two significant economic signals which like the proverbial “canary in the coal mine” have been strong predictors of past Bear Markets. Because of their rarity and historical significance, I think investors should consider these signals with more weight than opinions, forecasts, or projections.

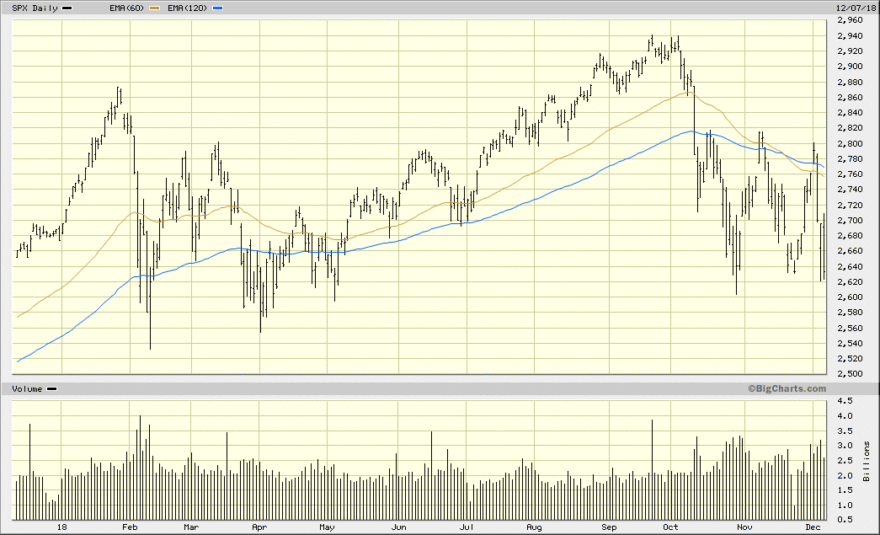
1. The crossover of the Equity Circuit Breaker. We’ve described this technical analysis previously, but here is a quick review: We look at the S&P 500 Index and calculate Moving Averages based on the previous closing prices of the past 60 and 120 days. That is each day, we look back at the previous 60 and 120 days. When the market is in an uptrend, the 60 day moving average stays above the 120 day average and both lines are sloping upwards. 

In a Bear Market, a prolonged downturn, the 60 day moving average is below the 120 day average and both are sloping down. The signal occurs when these two lines crossover; this reflects a potential change in regime from an up market to a down market. Because we are looking at longer averages – 60 and 120 days – this analysis usually tunes out brief market panics of a month or two. A crossover occurred this year at the end of November.  

This crossover was a good predictor in past Bear Markets; it would have gotten you out of stocks very early in the 2008 crash and back into stocks in the Fall of 2009. However, it can give false positives. Back in 2016, we also had a crossover occur for several months. That year, if you had traded on the crossovers, you would have gotten out at a loss and then had to buy back into stocks several percentage points higher.

2. Yield Curve Inversion. Typically, longer-dated bonds pay higher interest rates than shorter bonds. This week, however, we briefly saw the five-year Treasury Bond trade at a lower yield than the two-year Treasury, an inversion of the normal upwards slope of the yield curve. 

Why should you care? A Yield Curve Inversion has been a good predictor of previous recessions. This shows that investors are bidding up five-year bonds, preferring to tie up their money for longer, seeing a lack of short-term opportunities elsewhere. It also reflects a belief that interest rates may fall.

Past Yield Curve Inversions have occurred in 1978, 1988, 1998, 2000, 2005-2006. In each case, except for 1998, a recession took place within a year or two. So it does not have a 100% track record of accuracy either, but it is a rare enough of an event that I think it is worth our very careful consideration. The seven previous recessions all were preceded by a yield curve inversion.

Read More: from Bloomberg, “The US Yield Curve Just Inverted. That’s Huge.”

Over the past several years, when people asked me what it would take for me to become concerned about a Bear Market, I would have told them these two things: a crossover of the moving averages and a yield curve inversion. Both have been good (but not perfect) predictors of past Bear Markets and Recessions. And both have occurred since Thanksgiving this year.

The market may continue to go up in 2019, so I cannot assume anything with certainty. Still, I am concerned enough about these two signals that we are going to be slightly reducing our equity exposure and risk levels for our 2019 models. This is a temporary, tactical move and we will look to move back to our target equity weighting either when we feel that prices are significantly distressed, or after the moving averages have crossed back upwards. We are not going 100% to cash; at this point, we are considering reducing equities by 20%, pending further analysis this week.

We will be making necessary trades on a household by household basis before January 1, making sure we minimize any possible tax liabilities. We will look to harvest losses in taxable accounts and to try to avoid creating gains except in IRAs. 

While there’s no guarantee these trades will be profitable, I take these two signals seriously enough that I feel compelled to act and will be doing the same trades in my own portfolio. If we do have a prolonged Bear Market, we may wish to have sold even more. However, I want to balance that risk with the fact that these signals could be wrong this time. Perhaps the market continues up for another year or two before there is a recession and we miss out on significant further gains.  

Investors were not at all successful at timing the market back in 2007-2009, even though with the gift of hindsight, we might think it will be “easy” to see and act next time around. My goal remains to create effective, diversified portfolios that are logical, low cost, and tax-efficient. Making tactical adjustments to reduce risk and hopefully enhance returns is what clients expect from me, but we do not make these changes lightly. If you have questions about your portfolio, or want to talk in more detail about these signals, or the economy, I am always happy to have a conversation about what we can do for you.

Investing for Good

Four years ago, I wrote about Socially Responsible Investing (SRI) in this blog. SRI is investing in companies based on an assessment of their Environmental, Social, and Governance policies, or ESG. In 2014, SRI funds had just passed $100 Billion in assets and have since grown twenty-fold to over $2 Trillion globally.

At that time, I had reservations that SRI funds carried a number of pitfalls, including weak diversification, high expense ratios, and poor performance. I discussed one of the original SRI exchange traded funds, KLD, which in 2014 had an expense ratio of 0.50%.

Things have changed for the better. Today we have new SRI funds which are better diversified and have reduced tracking error versus a core Index-based ETF like we normally suggest. Expense ratios have fallen dramatically, with some SRI funds as low as 0.15% to 0.20%, which is much more competitive with traditional ETFs.

With these newer funds, I think we can now say that investing using SRI principles should have similar performance to our traditional portfolios. I don’t know that the performance will be any better, but I no longer am concerned that SRI will automatically condemn you to under-performing a non-SRI approach today.

For the first time, we have the tools to create a globally diversified portfolio of SRI funds which are low cost, transparent, and rules-based. What is lacking, however, is a long track record: of the 38 or so SRI ETFs available to US investors today, about half are less than two years old. This requires extra research and due diligence to understand what you are actually buying and how the fund might perform in different market environments.

For a lot of investors, we want to invest in companies which do good, and not the ones who pollute the environment, support dictators, sell tobacco, or treat their employees, customers, or shareholders with callous disregard. That’s the appeal of SRI; it aligns our money with our values.

When you invest in an index fund, you own all the stocks in a benchmark, including some which maybe you’d rather not own. With the proliferation of index investing, the largest shareholders of many companies are often Vanguard and Blackrock, the two largest index fund providers.

Although index funds vote on behalf of shareholders, they have largely voted in favor of management proposals. Indexers cannot sell their shares if a company is doing bad things. If it’s in the index, the fund has to own it. This weakens the role of shareholders as owners and beneficiaries of corporate decisions and the accountability of executives to shareholders.

I see a beneficial role for SRI investors within capitalism because they tell company executives and boards that they have to do better on ESG criteria or we will not invest in their company. To that extent, I believe we are already seeing improved corporate behavior thanks to SRI investors including ETFs, activist funds, and large pension plans such as CalPERS.

Are you interested in Socially Responsible Investing? Would you like to see what your portfolio might look like if we used SRI funds instead of traditional Index ETFs? We do not want to sacrifice performance, which is why we have been cautious about adopting SRI funds. But with better diversification and lower expense ratios, today’s SRI funds are significantly improved. Let’s talk about how we might implement SRI for you.

How to Get Paid for Limit Orders

When we place an order for a stock or Exchange Traded Fund (ETF), there are a couple of ways we can make a purchase. The easiest is a Market Order, which simply instructs our custodian (TD Ameritrade Institutional) to purchase the specified number of shares at the current market price.

Sometimes, however, we may want to purchase shares at a lower price or wait until the market falls to a specific level. This can be achieved through a Limit Order – which says that we will buy our position only at or below a price we indicate. Of course, the challenge with a Limit Order is that there is no guarantee that the price will in fact fall to our target!

Many investors who use Limit Orders, especially in a Bull Market like we’ve had in recent years, see prices move up and their orders never fill. Then they are faced with the ugly choice of having to buy at a higher price than if they had just used a Market Order at the beginning. And instead of participating in the growth of the market, they sit on the sidelines in cash. So there can be a real opportunity cost to Limit Orders. In reality, Limit Orders are a type of market timing, where an investor thinks they can predict short term moves and profit from those fluctuations.

There is a third, more complicated option, which most investors don’t know how to do. Like a Limit Order, we can select a target price that we would like buy a stock or ETF within a certain time frame. And like a Limit Order, if the price falls to or below this level, we will buy the shares at our target price. Unlike a Limit Order, we can get paid for our willingness to buy these shares, regardless of whether or not the order fills, by using options.

It is done by selling a Put. A Put is an option which requires you to buy a security for a specific price (called the “strike price”) before or at the expiration of the option (typically one month to one year). When you sell a Put, you receive a premium upfront in exchange for agreeing to buy shares at the strike price. One options contract equals 100 shares.

Let’s walk through an example. You are looking to buy the iShares Emerging Markets Index, ticker EEM. As of the Friday August 17 close, you could have bought EEM at the market at $42.21. 100 shares would have cost $4,221. But maybe you thought it could go lower, so instead, you enter a Limit Order for $40. Now, if EEM falls to $40, you will buy your 100 shares for $4,000.

Alternatively, you could sell a November $40 Put on EEM for $83. That means you would get paid $83 in exchange for the right for someone else to make you buy 100 shares of EEM for $40 a share between now and November 16, 90 days from now. If EEM falls to $40 or below, you will buy 100 shares for $4,000 just like in the limit order, plus you made the $83. Even if EEM stays above $40, you keep the $83 no matter what.

I know that $83 isn’t much, it represents about 2% of the price of EEM. That’s over 90 days, so if we consider the value of selling this option on an annualized basis, it is a bit over 8% a year. That’s a lot better than using a limit order and not making anything.

Let’s consider the difference between a market order, a limit order, and selling a Put using two different scenarios, at 100 shares. Today’s price is $42.21 and I’m disregarding commissions and taxes in these examples.

1. The price rises to $45. If you bought at the market ($4,221), you would have a profit of $279. If you placed a limit order at $40, your order never filled and you have nothing. If you sold the put, you would not have any shares, but you would have the $83.

2. The price of EEM falls over time to $38 a share. If you bought 100 shares at the market ($4,221), your shares are now worth $3,800 and you are down $421. If you set a limit order at $40, you would have bought 100 shares for $4,000 and you are now down by $200. If you sold a put, you’d also buy 100 shares at $4,000, but since you collected the $83, you now have a lesser loss of $117.

So whether the price goes up or down, selling a Put is generally going to be better than a limit order. The only example where this might not occur is if a stock has a big gap down overnight – for example, it is at $41 one day and the next morning opens at $38. In this case, your limit order will fill at the open at $38. This does happen sometimes, but it is fairly unusual. Most limit orders, if they fill, end up being executed right at your limit price.

Who is taking the other side of the option? The buyer of a Put is likely a “hedger”: they are buying the Put as protection to preserve their money in case the stock goes down. Or they are a speculator who is betting that the stock will fall. Both are bad bets, statistically. When the expected return of the market is only 8%, paying an 8% annualized premium to hedge your position is in effect giving away all of your potential upside.

Instead, I’d rather be the person selling them this insurance and be the seller of the Put. I’ve spent may years selling Puts (and Calls, too) and am not recommending this is something you try to do on your own. Not every stock or ETF has an active options market and you should be very careful with thinly traded options.

But this is a strategy we use with some of our clients in place of Limit Orders and I wanted to share with all of you an very brief overview of how it works. Please note that options are only available on securities which trade on the exchange and not on mutual funds. What I do not recommend is selling Puts as a speculative bet. Only sell Puts for shares you want to buy and own as a long-term investment. Additionally, to sell Puts, you must either have either cash in the account or a margin account. If you’re interested in learning more about selling Puts in place of limit orders, please reply to this email.

Note: accounts must be approved for options before trading can begin. Please see The Characteristics and Risks of Standardized Options for more information.

Increase Returns Without Increasing Your Risk

In theory, Return and Risk are linked – you cannot get a higher rate of return on an asset allocation without taking more risk. However, portfolios can be inefficient and there are a number of ways we can improve your return without adding risk or changing your asset allocation. Here are five ways to increase your returns:

1. Lower Expense Ratios. Many mutual funds offer different “share classes” with different expense ratios. The holdings are the same, but if one share class has 0.25% more in expenses, those shareholders will under perform by 0.25% a year. Here at Good Life Wealth Management, we have access to Institutional shares which have the lowest expense ratio. Generally, these funds are available only to institutions or individuals who invest over $1 million. We can buy these shares for our investors, without a minimum, which frequently offer savings of 0.25% or more versus “retail” share classes.

2. Increase your Cash Returns. If you have a significant amount of cash in your holdings, make sure you are getting a competitive return. Many banks are still paying 0% or close to zero, when we could be making 1.5% to 2% elsewhere.

3. Buy Treasury Bills. If you have a bond mutual fund and it charges 0.60%, that expense reduces your yield. If the bonds they own yield 2.8%, subtracting the expense ratio leaves you with an estimated return of 2.2%. Today, we can get that level of yield by buying Treasury Bills, such as the 26-week or 1-year Bill, which have a short duration and no credit risk. If you are in a high expense bond fund, especially a AAA-rated fund, it may be preferable to own Treasury bonds directly and cut out the mutual fund expenses. We participate in Treasury auctions to buy bonds for our clients.

4. Buy an Index Fund. If you have a large-cap mutual fund, how has it done compared to the S&P 500 Index over the past 5 and 10 years? According to the S&P Index Versus Active report, for the 10-years ended December 2017, 89.51% of all large-cap funds did worse than the S&P 500 Index. Keep your same allocation, replace actively managed funds with index funds, and there’s a good chance you will come out ahead over the long term.

5. Reduce Taxes. Two funds may have identical returns, but one may have much higher capital gains distributions, producing higher taxes for its shareholders. If you’re investing in a taxable account, take some time to look at the “tax-adjusted return” listed in Morningstar, under the “tax” tab, and not just the gross returns. Even better: stick with Exchange Traded Funds (ETFs) which typically have much lower or even zero capital gains distributions. This is where an 8% return of one fund can be better than an 8% return of another fund! We prefer to hold ETFs until we can achieve long-term capital gains, and especially want to avoid funds that distribute short-term gains. We also look to harvest losses annually, when they occur, to offset gains elsewhere.

How can we help you with your investment portfolio? We’d welcome the chance to discuss our approach and see if we would be a good fit with your goals.