Manager Risk: Avoidable and Unnecessary

You can choose between two funds, A or B. If Fund A has an 85% chance of beating Fund B over five years, would those be good enough odds for you to want to pick Fund B?

More and more investors are realizing that using active equity managers is a bad bet. This is Manager Risk, which is the risk that your portfolio fails to achieve your target returns because of the active managers you selected. When there is a significant probability that a manager lags an index fund and only a small chance that a manager beats that index, taking that risk is going to be a losing proposition for the majority of investors.

Here are three ways Manager Risk can bite you:

1. Performance chasing doesn’t work. Top funds often have a good story about their “disciplined process”, or “fundamental research” approach, but there are so many reasons why today’s leader is often tomorrow’s laggard:

  • Massive in-flows of cash into popular funds make it more difficult for managers to be nimble and to find enough good investment ideas to execute.
  • It’s possible that the fund’s specific approach (style, size, sector, country, etc.) was in-favor recently and then goes out of favor.
  • With thousands of funds, some are going to be randomly lucky and have a period of strong performance that is not repeatable or attributable to skill.

2. The data is clear: over a long-period, the vast majority of funds do not keep up with their index. According to the Standard and Poors Index Versus Active (SPIVA) report: 84.23% of large cap funds failed to keep pace with the S&P 500 Index over the five-years through December 29, 2017.

If 17 out of 20 large cap funds do worse than the S&P 500, why do people bother trying to pick a winning fund, instead of just investing in an Index Fund? I think some of it is that over shorter periods, it can be pretty easy to fund funds that are out-performing and people mistakenly think that recent leaders are going to continue their winning streak.

Consider, amazingly, that nearly 85% of Small Cap Growth funds did better than their benchmark in 2017 according to SPIVA. What a great environment for active managers, right? They must have a lot of skill! But let’s look back further: over the past 15 years, 98.73% of those Small Cap Growth funds lagged their index. That is the worst performance of any investment category in the SPIVA report.

If your odds of outperforming the index over 15 years is only 1 in 100, you’d be crazy to bet on an active manager. It’s a risk that isn’t worth taking.

3. In some categories, there are 10-20% of managers who do outperform the benchmark over five or more years, which means that there might be dozens of funds which have done a nice job for their shareholders. Why not just pick one of those funds?

Standard and Poors also produces The Persistence Scorecard, which evaluates how funds perform in subsequent periods. Let’s look at two five year periods, in other words, the past 10 years. Imagine that five years ago, you looked at the top quartile (the top 25%) of all US Equity funds. How did those top funds do over the next five years (through December 2017)?

25.34% remained in the top quartile
21.56% fell to the 2nd quartile
18.87% fell to the 3rd quartile
23.45% sank to the bottom quartile (the worst 25% of all funds)
10.24% were liquidated or merged, which is the way fund companies make their lousy funds’ track records disappear.

So, if you picked a top quartile fund, you had about only a one-in-four chance (25.34%) that your fund stayed in the top quartile (which is no guarantee that you outperformed the index, by the way). But, you had a one-in-three chance (33.69%) that your fund fell to the bottom quartile or was liquidated and didn’t even exist five years later. Again, those are not odds that are in your favor.

This is why fund companies are required to state, Past performance is no guarantee of future results. We can look backwards at fund history, but that information has no predictive value for how the fund will perform going forward.

It’s an unnecessary risk for investors to use actively managed funds. And that’s why I have moved away from trying to pick 5-star actively managed funds, and have embraced using Index funds.

From time to time, you may hear, “this is a stock picker’s market”, because of volatility, or concentrated returns, or whatever. Don’t believe it. Even when active managers are able to have a good month, quarter, or year, the vast majority remain unable to string together enough good years in a row to beat their benchmark.

There’s enough risk in investing as it is. Let’s reject Manager Risk and instead recognize that an Index Fund is the most likely way to beat 80, 90% or more active funds over the long-term.

When To Get Out Of Equities

Look at each time the S&P 500 Index fell by 8% since 1928, and you will find two very different types of outcomes. 85% of the time, an 8% drop resulted in only a shallow correction, an average of 13%, which the market recovered from, on average, in just 106 days. That’s tolerable.

However, in 15% of the 8% drops, the stock market was headed into a severe Bear Market, suffering an average decline of 43%, which took 1090 days to recover.* That’s three years – from the bottom – just to get back to even. Anyone who invested through the Tech Bubble in 2000-2001 and the Crash of 2008-2009 needs no reminder that Bear markets have always been a part of investing.

Given a choice, wouldn’t you rather be on the sidelines when things are falling apart? Investors of all ages feel this way, but for those who are closer to retirement, we don’t have the luxury of saying, “Well, I can just Dollar Cost Average since I don’t need to touch this money for 30 years”.

Most sources say you cannot time the market. That’s because people usually base their decisions on sentiment and worthless forecasts. We are blind to our own confirmation bias, where we look for opinions that support our prejudices, rather than looking objectively at all evidence.

Without a crystal ball, how can you tell when a small drop is just a brief correction versus the first weeks of a longer Bear Market?

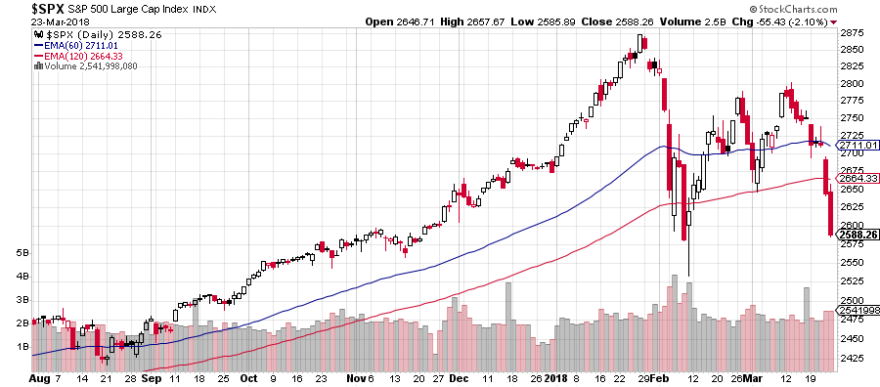
To remove human emotion and look solely at the price movement of the market is the objective of Technical Analysis. Let’s consider a chart of the historical prices of the S&P 500 Index. One of the ways to examine the larger trend of market is through a Moving Average (MA). This is simply a measure of the average price over a number of days, such as 20, 60, 120, or 200 days. A Moving Average with small number of days responds quickly to changes in market prices, whereas a MA based on a large number of days is smoother and slower to react.

When the market is boldly moving up (like in 2017), a chart will have these characteristics:

  • The 60-day moving average is above the 120-day moving average, and both have an upwards slope, gaining each day.
  • The current price of the market is above the moving averages, pulling the averages higher.

When we are in a prolonged decline (like in 2008), a chart will typically have the reverse characteristics:

  • The 60-day moving average is below the 120-day moving average, and both have a downwards slope, sinking each day.
  • The current price of the market is below the moving averages, pulling the averages lower.

A brief drop, like we experienced in February, is a temporary blip in the market price and has little impact on the longer 60 or 120 day moving averages. Technical Analysis suggests that a Bear Market may be starting when there is a crossover – when the 60-day MA goes from being above the 120-day MA to being below it.

Crossovers are considered a major shift in the direction of the market, and often do not occur for years at a time. Crossovers occurred relatively early in the previous two Bear Markets and if you had used that signal to sell, you would have significantly reduced your losses. The reverse crossover, when the 60-day breaks above the 120-day MA, is considered a Bullish indicator that the downwards trend has broken. That’s the Buy signal to get back into the market.

A few caveats are in order: these signals will not pinpoint the top or bottom of the market. With a 60-day lag, the market could have already have suffered significant losses before we get a “Sell” signal. Similarly, at the bottom, the market could have rebounded by a substantial percentage before we get the “Buy” signal to get back in. In a shorter Bear Market, these indicators might have you get out at a loss and then buy back in at a higher level, adding insult to injury.

Looking at back-tested funds which use this approach, however, they would have had lower losses in the past two Bear Markets. While it’s nice to avoid the losses, what is even more compelling is how well the strategy performs over 10 or more years. After studying this for nearly two years, we are now going to offer this strategy to our clients, calling it the Equity Circuit Breaker.

This does not change what we purchase in our portfolios. Investors will have the choice of adding the Equity Circuit Breaker or not. If you want to participate, we will track these moving averages and when a crossover occurs, we will sell your equity positions and move the proceeds into cash or short-term Treasuries. When the Bullish crossover occurs, we will buy back into your equity funds, returning to your target asset allocation.

The goal is to reduce losses then next time we have a Bear Market. While there is no guarantee this program will work exactly as it has in the past, you might prefer to have a defensive strategy in place versus the alternative of staying invested for the whole ride down and back up.

I am making this optional for two reasons. First, some investors have a long enough time frame to accept market volatility and prefer a simpler approach. Second, taxes. Selling your equity positions in a taxable account could generate capital gains.

But let’s take a closer look at the tax question. Let’s say you have a 50% gain in your equity positions. You started at $200,000 and it has grown to $300,000. If we were to sell those positions and create $100,000 in long-term capital gains, you’d be looking at 15% tax, or $15,000. (Long-Term Capital Gains could be as high as 23.8% for those in the top tax bracket.) That is a substantial amount of tax, but could still be worth it. If we avoid a 20% drop, you would have prevented $60,000 of losses.

Paying some taxes along the way also will increase your cost basis and basically just pre-pay taxes you would otherwise pay later. For example, Investor A buys a fund for $10,000, sells it at $15,000 after year two and generates a $5,000 capital gain. Then she buys back into the fund with the $15,000 and sells it at $18,000 at year five, for a $3,000 gain. Investor B buys a fund for $10,000, holds it for the same five years, and then sells for $18,000. Both investors will pay the same tax on $8,000 in capital gains. Investor A just split that tax into two segments whereas Investor B paid the tax all at the end.

Of course, if your accounts are IRAs, we could trade without any tax consequences. If you’d like to add the Equity Circuit Breaker to your Good Life Wealth Management Portfolio, there is no additional cost, just reply to this email. We also offer the option of limiting the Equity Circuit Breaker to your IRAs and not to your taxable accounts. I’ll be talking with clients individually throughout the Spring about the new program.

As of today, we have not had a crossover, so there is not yet a trigger for us to sell. I will be looking at this on a regular basis. Investors should make the decision about participating well in advance of the trigger occurring. Once the losses have already started, it is harder to make a decision. I think the best use of this approach is passive – to consider it carefully in advance, turn it on (or not), and then leave it alone. We will do the work for you.

If today’s market is making you nervous, the Equity Circuit Breaker may help you sleep better at night. You have been telling us “we want to participate in the upside, but want to step aside when things get ugly.” If that’s what you’ve been thinking, feeling, or wishing, we can provide you with a plan that’s based on a disciplined process.

*Market Pulse, Goldman Sachs Asset Management, February 2018

Markets Soared in 2017

2017 was an outstanding year for investors. Markets went up throughout the year with little volatility and no significant pull-backs. This certainly has been a pleasant surprise, given the political uncertainty, noise, and dysfunction in Washington. Here’s a quick overview of the performance of major indices this past year.

The S&P 500 Index was up 21.83%, in total return. US stocks were already fairly valued at the start of the year, but investor enthusiasm for technology companies has pushed markets even higher. That means we start 2018 at even higher valuations than those which concerned us a year ago.

I’d also note that growth stocks outperformed value strategies, by nearly 2X in 2017. I think this will reverse at some point as value stocks have a widening discount to growth companies. US Large Cap outperformed Small Cap by a wide margin, reflecting the more expensive valuations of small companies.

Look at international markets, the MSCI EAFE index, representing developed economies outside the US, was up 25.03%. The MSCI Emerging Markets Index soared 34.35% on the year. Both of these were boosted by a sagging dollar in 2017. We don’t make active bets on currency direction, so we don’t have an opinion on whether or not this continues to enhance returns in 2018. However, economic growth and stock fundamentals are both favorable for international stocks in the year ahead.

Turning to bonds, the Barclay’s Aggregate Bond Index was up 3.54%, a decent return for a year in which the Federal Reserve raised rates three times. We believe that bond investors should have modest expectations for 2018. Rising rates suggest favoring shorter duration bonds for defense.

We’ve updated our portfolio models for 2018 and can celebrate the returns we received in 2017. We remain broadly diversified and get most of our equity exposure from low-cost, tax-efficient index ETFs. Our overweight to Emerging Markets has been beneficial this past year, although our allocation to US Value has been a drag on performance. The rationale for both positions remains unchanged so we will continue to hold both.

We spend considerable time on investment management, but generally, think it is more beneficial to you to write here about financial planning topics. As always, if you have any questions about investment strategies, please feel free to reply or call anytime.

Source of data: Morningstar as of 12/30/2017. 

Introducing our Ultra Equity Portfolio

We are launching a new portfolio model for 2018, Ultra Equity, a 100% stock allocation. Previously, our most aggressive allocation was 85% stocks and 15% bonds. This type of approach clearly is not for everyone, but if you want the highest possible long-term return and can ignore short-term volatility, Ultra Equity might make sense for you.

Bond yields remain very low today, and bond investors face rising risks, including interest rate risk, that rising interest rates depress bond prices, and purchasing power risk, that inflation eats up all your yield. While defaults have been quite low in recent years, as interest rates rise, it will be increasingly difficult for distressed companies, municipalities, and countries to meet their obligations. The level of debt globally has swelled enormously with the cheap access to capital since 2009, and yet the bond market is acting if all this debt hasn’t changed risks at all.

While the Federal Reserve raised the Fed Funds rate again this week, income investors have been disappointed that there are not more attractive opportunities in bonds today. Unfortunately, the rising rates have not benefited all types of fixed income vehicles equally. On the short end, yes, yields are up. We can now access short-term investment grade bonds with yields of around 1.5% to 2%.

However, the yields on longer bonds have barely moved. The 10-Year Treasury is at 2.35% and the 30-Year remains shockingly low at 2.71%. As a result, we have a “flattening” of the yield curve where short-term rates have increased, but long-term rates are virtually unchanged.

I expect this trend to continue in 2018: rising short-term rates and a flattening yield curve, which means there will continue to be a dearth of opportunities for yield-seeking investors. As a point of reference, the historical rate of return for intermediate bonds was 7.25%, but today, you can’t find anything at even half of that rate. We are always thinking about how we can position portfolio allocations to aim for the best possible return with the least amount of risk and the maximum amount of diversification. But at this point, bonds offer little potential for high returns. Instead, we have to think of bonds as risk mitigators, that the primary purpose of our bonds is to offset the risk we have with our equity holdings.

I’ve been reluctant to roll out a 100% equity allocation with the stock market at an all-time high in the US, because it risks falling into the behavioral trap of becoming too enamored with stocks during a bull market, and ignoring stocks’ volatility and potential for losses. For investors with a horizon of more than 10 or 20 years, there is little possibility that a bond allocation will increase your rate of return. If you are comfortable with ignoring volatility, I think some younger investors may want to invest 100% in equities.

Consider this: the expected return on intermediate bonds is only 3.5% over the next 10 or so years. If you have a 60/40 portfolio and earn 3.5% on your bonds, you will need to make at least 11% on your stocks to reach an overall return of 8%. Many investors are coming to the conclusion that to achieve their goals, the optimal allocation to bonds may be zero.

If you are making regular contributions to an equity allocation, you also have the opportunity to dollar cost average, and buy more shares at a lower price, if the market does drop at some point. And while dollar cost averaging does not guarantee you will not experience losses, it is nevertheless an effective way to accumulate equity assets and possibly benefit from any volatility that does occur.

Our Ultra Equity portfolio will differ from our other portfolio models in that we are not looking to reduce risk or to achieve the best “risk-adjusted” returns. Instead, we will invest tactically in areas where we believe there is the greatest potential for strong long-term rates of return. We will always be diversified, investing in ETFs and mutual funds with hundreds or thousands of different securities, but will have no requirement to hold any specific category of investments.

We cannot know how a portfolio like this will fare over the near term, and there will undoubtedly be times when the stock market is down, sometimes even down significantly. If your attitude is that those drops represent opportunity, rather than adversity, then you should ask us more about Ultra Equity to see if it might be right for you.

Advantages of Equal Weight Investing

The four largest stocks in the United States are all tech companies today: Apple, Microsoft, Amazon, and Facebook. For 2017, these stocks are up significantly more than the overall market, 49%, 38%, 55%, and 52% respectively.

These are undoubtedly great companies, but as a student of the markets, I know you can look at the top companies of previous decades and notice two things. First, top companies don’t stay at the top forever, and second, the market goes through phases where it loves one sector or industry more than it should. (Until it doesn’t…)

And this is the knock on index funds. Because they are weighted by market capitalization, an index will tend to own a great deal of the over-valued companies and very little of the under-valued companies. The top 10 stocks of the S&P 500 Index comprise nearly 20% of its weight today. If you go back to 1999 and look at the valuation of the largest tech companies like Cisco, you can see how those shares were set up for a subsequent period of substantial and prolonged under-performance.

In spite of this supposed flaw in index funds, the fact remains that typically 80% of all actively managed funds perform worse than their benchmark over any period of five years or longer. If the index is hampered by all these over-valued companies, why is it so difficult for fund managers to find the under-valued shares? One possible reason is that the higher expense ratio of an active fund, often one percent or more, eats up the entire value added by the manager.

But there is an interesting alternative to market cap weighting, which avoids over-weighting the expensive stocks. It’s equal weighting. If you have 500 stocks, you invest 0.2% in each company. Your performance then equals that of the average stock, rather than being dependent on the largest companies. To remain equal weight, the fund will have to rebalance positions back to their 0.2% weight from time to time.

There have been extensive studies of the equal weight process, most notably by Standard and Poors which calculates an equal weight version of their S&P 500 Index, and by Rob Arnott, of Research Affiliates, who wrote about equal weighting in various papers and in his 2008 book “The Fundamental Index.”

But even better than studies, there has been an Equal Weight ETF available to investors since April 2003, a 14-year track record through Bull and Bear Markets. The results have been compelling.

– Since inception in 2003, the S&P 500 equal weight fund has had an annual return of 11.21% versus 9.53% for the cap-weighted S&P 500 Index.
– Equal Weight beat Market Cap over 57% of the one-year periods, on a rolling monthly basis since the fund started in 2003. However, the fund out performed over 84% of the five-year periods and 100% of the 10-year periods.
– You might think that by reducing the supposedly over-valued companies, the fund would have lower volatility, but that has not been the case. Instead, the fund has had a slightly higher standard deviation and actually lost more in 2008 than the cap weighted index. It’s no magic bullet; it’s primary benefit appears to be return enhancement rather than risk reduction.

We plan to add an Equal Weight fund to our portfolio models for 2018. Although some of our concern is that today’s tech stocks dominating the index are over-valued, we should point out that there is no guarantee that Equal Weight will be better than the Cap Weighted approach in 2018 or in any given year. However, for investors with a long-term outlook, the approach does appear to offer some benefits in performance and that’s the reason we are adding it to our portfolios.

Before August, the cheapest fund offering an equal weight strategy had an expense ratio of 0.40%. However, there is a new ETF that offers the strategy at an ultra-low cost of only 0.09%, which makes it very competitive with even the cheapest cap weighted ETFs.

If you have any questions on the approach, please feel free to email or call me. For positions in taxable accounts, we have significant gains in many portfolios. In those cases, we will not be selling and creating a taxable event. But we will be purchasing the new fund in IRAs and for purchases going forward.

Source of data: Morningstar.com and from Guggenheim Investments All Things Being Equal dated 9/30/2017.

Big Changes to Ameritrade’s ETF Platform

Exchange Traded Funds (ETFs) are a terrific vehicle for investors, offering an easy way to build diversified portfolios that are transparent, tax efficient, and low cost. We’ve written frequently about the advantages of ETFs and hold them as core positions within all of our portfolios.

This week, our custodian, TD Ameritrade, announced that it was expanding its platform of commission-free ETFs from 100 to nearly 300 funds. Wonderful, right? Not so fast… while the total number of ETFs will increase, they are actually dropping 84 low-cost ETFs, including ALL of the Vanguard ETFs we use for each and every client.

To say that we are disappointed and frustrated is an understatement. We are big fans of Vanguard and have used these funds since we opened three years ago. They are among our largest holdings. Why is TD Ameritrade dropping these funds? Distribution fees. Vanguard does not pay custodians to distribute their funds, but other companies will pay TD Ameritrade to be on their commission-free platform.

As a whole, the changes to the TD Ameritrade platform are appalling to me. We lose low cost ETFs from Vanguard and the iShares Core series, and instead are offered mainly niche ETFs with high expense ratios. Many of the new ETFs are focused on a very narrow area such as the “nasdaq smartphone index” or the “dynamic pharmaceuticals” ETF. This approach is antithetical to our process of diversification. Sometimes being given more options does not mean that you have better choices.

There is one bright spot: they are adding the new SPDR Portfolio Series from State Street. State Street is one of the three largest ETF providers, along with Vanguard and iShares, and is the creator of the original S&P 500 ETF, SPY,  which launched the whole ETF movement nearly 20 years ago.

In recent years, State Street has been struggling to keep up with lower cost competition from Vanguard, Schwab, iShares and others. The new Portfolio Series took a handful of their most diversified ETFs, many with track records of over 10 years, and slashed the expense ratios to levels at or below even Vanguard. These will be our new go-to funds.

We can of course, continue to buy and sell the Vanguard ETFs through TD Ameritrade. However, after November 16, those trades will incur a standard commission (as low as $6.95). And that is still a bargain. Should we drop our Vanguard funds in the next month, while they still trade for commission-free?

Here is our plan:

1. In taxable accounts, we may have significant capital gains in our Vanguard positions. It does not make sense to realize thousands of dollars in gains just to avoid a $6.95 commission. (If we had losses, we would harvest those losses, but the market is up nicely this year. I’m not complaining!)

2. Even when there is zero commission, there are still trading costs. Just like stocks, ETFs trade in an auction process where buyers offer a “bid” and sellers request an “ask” price. The Vanguard ETFs are heavily traded, sometimes with multiple trades in one second. The difference between the bid and ask price, the “spread”, is often only one cent.

However, on ETFs that trade less frequently, the spread can be much higher. I looked at a small-cap value ETF this week that had a 14 cent spread. So, even in non-taxable accounts like IRAs, there may still be a hidden cost if we were to sell Vanguard to buy the SPDRs. As trading volume increases, I anticipate bid-ask spreads will tighten on the newly added funds. But for larger positions, selling one ETF at the bid and buying another at the ask could certainly cost more than the $6.95 commission we are trying to avoid.

3. For new purchases, we will use the SPDR Portfolio Series, effective immediately. They trade commission-free and in many cases have a lower expense ratio than a comparable Vanguard Fund. Existing portfolios will continue to hold Vanguard Funds. This means that many portfolios will unfortunately now have some duplication, where for example, we might own a Vanguard International ETF and also own a similar SPDR International ETF. I try to avoid that sort of redundancy, but it does not really cause any harm.

4. In IRAs with smaller positions, we will look to sell Vanguard within the next few weeks and replace those positions with a new commission-free option. We will still be needing to rebalance portfolios annually, in which case, it is nice to be able to do so commission-free. These trades will be done on a case-by-case basis.

Please feel free to email or call me with any questions. This change at TD Ameritrade has created some temporary hassle, and received quite negative press on Wealth Management.com and in a scathing piece by Michael Kitces.

This change isn’t going to detract from our approach or impact our investment process. We start with a top down asset allocation and then choose the best fund to fulfill each segment of our allocation. We certainly don’t limit our search for investments to just commission-free ETFs, and have always also had mutual funds or ETFs that are not on the commission-free platform. As your Fiduciary, we take seriously our responsibility to keep fees as low as possible, but it’s not true that the lowest cost is always the best investment option.

Beware: 2017 Fund Capital Gains Distributions

We are starting to receive estimates for year-end 2017 Capital Gains distributions from Mutual Funds, and no surprise, many funds are having large distributions to their shareholders this year. As a refresher, when a mutual fund sells a stock within its portfolio, the gain on that sale is passed through to the fund owners at the end of the year as a taxable event.

When you invest in a 401(k), IRA, or other qualified account, these capital gains distributions don’t create any additional taxes for you. If you reinvest your distributions, your dollar value of the fund remains the same, and you are unaffected by the capital gain. However, if you are investing in a taxable account, these distributions will cost you money in the form of increased taxes.

A quick look at estimates from American Funds, Columbia, and Franklin-Templeton shows that many equity funds are having capital gains distributions of 3-10% this year. A few are even higher, such as the Columbia Acorn (17-21%) and Acorn USA (23-28%). Imagine if you made a $100,000 investment at the beginning of the year, your fund is up 16% and then you get a distribution for $28,000 in capital gains! Yes, capital gains distributions can exceed what a fund made in a year, when the fund sells positions which it owned for longer.

Capital Gains Distributions create a number of problems:

  • Even if you are a long-term shareholder, when the fund distributes short-term gains, you are taxed at the higher short-term tax rate.
  • If you didn’t sell any of your shares, you will need to find other money to pay the tax bill, which can run into the thousands each year if you have even just a $50,000 taxable portfolio.
  • If you are thinking of buying mutual fund shares in Q4 of this year, you could end up buying into a big December tax bill and paying for gains the fund had 6-12 months ago.
  • In addition to paying capital gains on fund distributions, you will still have to pay tax when you sell your shares.
  • Capital gains distributions are in addition to any dividends and interest a fund pays. In general, we want dividends and interest income as additions to our total return. Capital gains distributions, however, do not increase our return and are an unwelcome tax liability.

If you have a taxable account, or both taxable and retirement accounts, we may be able to save you a substantial amount of money on taxes. We can use tax-efficient investments like Exchange Traded Funds (ETFs), which typically have little or ZERO capital gains distributions at the end of the year. This puts us in control of when you want to sell and harvest your gains. When you have multiple types of accounts, we can place the investments into the best account to minimize your tax bill.

If you do presently have mutual funds in a taxable account, it may be a good idea to take a look at your potential exposure before the end of the year so you are not surprised. If you sell before the distribution is paid, you can avoid that distribution. Now that will mean paying capital gains based on the profit you have when you sell. But you definitely want to be planning ahead. When you’re ready to create a tax-managed portfolio that looks at all your accounts together, we can help you do that.

Are You Making These 6 Market Timing Mistakes?

Market timing means moving in and out of the market or between assets based on a prediction of what the market will do. Given the extreme difficulty of predicting the future, market timing is frowned upon by most academics. Many studies have shown that the majority of investors who time the market under-perform those who stay invested.

Even though many people know intellectually that market timing is detrimental, it is actually pretty difficult to stay invested and not be influenced by market timing. Even for those who say they don’t time the market, there are a number of ways that investors inadvertently fall into this trap.

1. Being in Cash. “We are going to sit on X% in cash and wait for a buying opportunity.” Seems prudent, right? Except that investors who have been holding out for a 10% or 20% crash for two, three, four years or more have missed out on a huge move up in the market. Yes, there are rational reasons to say that the market is expensive today, but those who have been sitting in cash have definitely under-performed. Will they eventually be proved right? The market certainly has cycles of growth and contraction. This is normal and healthy. So, yes, there will be another bear market. The problem is that trying to predict when this will occur usually makes returns worse rather than better.

2. Greed and Fear. The human inclination is to want to invest when the market has done well and to sell when the market is in the doldrums. I remember investors who insisted in going to cash in November 2008 and March 2009, right at the bottom. In 1999, people were borrowing money to put into tech funds, which had given them returns of 30%, 50%, even 100% in a year. Our natural reaction is to buy high and sell low, the opposite of what we should be doing. It’s only in hindsight that we recognize these trades as mistakes.

3. Performance Chasing. Investors like to switch from Fund A to Fund B when Fund A does better. Who wouldn’t want to be in the better fund? This is why people give up on index funds. Index funds often only beat half of their peers in any given year, so it’s super easy to find a fund that is doing better. However, when we go to a five-year horizon, index funds are winning 80-90% of the time. That’s why switching to a fund with a better recent track record is often a mistake. (And then watch the fund you just sold soar…)

4. Sector and Country funds. Investors want to buy a sector or country fund when it is a standout. This is market timing! You are buying what is hot (expensive) rather than buying what is on sale. I have yet to have any client ever come to me and say “sector X is doing terrible, should we buy?”. Instead, some will ask me about biotech, or India, or some other high flyer. I remember when the ING Russia fund had the best 10-year track record of all mutual funds. If you bought it then, I think you would have regretted it immensely in the following years! When people buy sector or country funds, the decision is almost always a market timing error of extrapolating recent performance into the future, instead of recognizing that today’s leaders become tomorrow’s laggards.

5. Factor Investing. If you haven’t heard of Factor Funds, you will soon! Quantitative analysts look for a set of criteria which they can feed into a computer and it picks the best performing stocks. How do they come up with a winning formula? By back-testing strategies using historical stock prices. This sounds very scientific, and I admit that it looks promising, but there are still some market timing landmines for investors, including:

  • Historical anomalies. It’s possible that a strategy that worked great over the past 10 years might be a dud over the next 10. It is unknown which factors will perform best going forward and it seems naive to assume that the future will be the same as the past.
  • Choosing which factor. Low Volatility? Value? Momentum? Quality? Those all sound like good things. There are now so many flavors of factors, you have to have an opinion on the market in order to pick which factor will outperform. And that’s right back to market timing: investing based on your prediction of what the market will do. This isn’t Lake Woebegone, where all the factors are above average. Some factors are bound to do poorly for longer than you are likely to be willing to hold them.
  • Investor switching. In most single years, a factor does not have very exciting performance. I predict that many investors are going to buy a factor fund, and then switch when they see another factor outperform for a year or two. If you’re really going to buy into the factor philosophy, you need to buy and hold for many, many years. Even in back tests, there are quite a few years of under-performance. It was only over long time periods that factors were able to deliver improved returns.

6. Product development. Asset managers are paid on the assets they manage. It’s a business. They will always be coming out with a new, better product to attract new investors. You are being marketed to every day by companies who want your investment dollar. Many new funds will not survive the test of time and will disappear into financial history. Their poor track records will be erased from Morningstar, which is why we have “survivorship bias”, the fact that we only see the track records of the funds that survive. Please use caution when investing in a new fund. Is this new fund vital to your success as an investor or just a marketing ploy for a company to capitalize on the most recent fad?

At Good Life Wealth Management, we are fans of the tried and true and skeptical when it comes to the “new and improved”. We aim to avoid market timing errors by remaining invested and not trying to predict the future path of the market. We avoid emotional investing decisions, performance chasing, and sector/country funds. For the time being, we are watching factor funds with curiosity but a wait and see attitude.

How then do we choose investments and their weight in our asset allocation? Our tactical models are based on the valuation of each category. This is by its nature contrarian – when large cap becomes expensive, it becomes smaller in our portfolios. When small cap becomes cheap, its weighting is increased. We don’t predict whether those categories will go up or down in the near future, but only tilt towards the areas of better relative value. This is based on reversion to the mean and the unwavering belief that diversification remains our best defense.

If you’d like to talk about your portfolio, I’d welcome the chance to sit down and share our approach and philosophy. What keeps us from the Siren song of market timing is our belief in a disciplined and patient investment strategy.

Bye Bye High Yield Bonds

We’re making a trade in our portfolio models this week and will be selling our high yield bond fund (SPDR Short-Term High Yield ETF, ticker SJNK). The last 18 months have been excellent for high yield bonds; so excellent, in fact, that at this point the now lower yields don’t justify the risks. For those who might be interested in our process behind this decision, please read on.

High Yield, or “Junk”, Bonds are highly cyclical and go through wide swings up and down. They have much higher volatility than other types of bonds, and in spite of their higher yields, have the potential for negative returns to a greater degree than most other types of bonds. Additionally, they have a fairly strong correlation to equities, meaning that when stock markets plunge, high yield bonds – which are issued by lower quality companies – are also likely to drop in value. In times of recession, several percent of high yield issuers will default on their bonds and go bankrupt each year.

How can we determine if high yield bonds are a good value? One of then most common ways is through Credit Spreads. A Credit Spread is the additional amount of yield a high yield bond will provide over a safe bond like a US Treasury.

As recently as January 2016, high yield bonds were paying 6-7 percent over Treasuries. Today, that spread has shrunk into the 3% range, a level which is closer to the lows of the past 20 years. You can see a chart of US Credit Spreads on the website of the Federal Reserve Bank of St. Louis.

Investors today are not being sufficiently compensated for taking the extra risk of high yield bonds, and given the headwinds of higher interest rates and a late-inning stock market, we believe it is time to remove the high yield position from our portfolio. They’ve done their job. While no one can predict if or when these bonds will have their next downturn, we’d rather make the change now.

This is a small trade in most portfolios; our 60/40 model, for example, has only a 4% position in high yield. The proceeds will be reinvested into other bond funds which have lower volatility and also a short duration.

In the future, if yield spreads widen, we might buy back into high yield bonds. When pessimism is at its highest, low prices on high yield bonds can be a great value for patient investors. And that’s the time to be a buyer, not today. Credit spreads are a unique consideration for high yield bonds, but know that we look at each category within our portfolio models closely and will not hesitate to make adjustments after cautious and deliberate study.

If you have any questions about high yield bonds, fixed income, or any other aspect of portfolio construction, please give me a call!

Mid-Year Report: The Return of Irrational Exuberance?

We’ve passed the mid-year point and the market has had a strong performance in the first half of 2017. Investors should be very pleased with the results of the past six months, although I believe there are reasons to be guarded going forward. Our portfolio models all notched positive returns, but our value oriented approach held back returns relative to our benchmarks.

Looking first at stocks, our global equity benchmark, the MSCI All Country World Index (iShares ticker ACWI) produced a total return of 11.92%. That would be a great return for the whole year, and it’s only July 1 as I write this. US Stocks, such as the Russell 1000 Index (iShares ticker IWB) were up 9.15% in the first half.

Across the board, international stocks were well ahead of US Stocks, with both Developed and Emerging Markets producing 15% returns for the first half. Our International and Emerging small caps did even better, over 17%. Our positions in foreign equities were strong contributors to our portfolio returns. If you are just investing in domestic stocks, you really missed out so far in 2017. And International stocks remain less expensive than US stocks by most measures.

Our holdings in US Value stocks lagged, gaining only 2-4% versus the 9% of the overall market. Last year, Value outperformed both Growth and Core by a wide margin. For 2017, a handful of technology companies are dominating returns, specifically the so-called FAANG stocks: Facebook, Apple, Amazon, Netflix, and Google (now called Alphabet).

While these companies continue to post exciting growth, the price of these stocks is now incomprehensible to me. It feels like 1999 all over again, when there was no price too high for growing tech leaders. While I think that today’s top stocks are bonafide companies with genuine earnings, I still can’t justify the price of the shares.

It smells like a bubble to me, although limited to this small number of stocks. Now that doesn’t mean that we are necessarily on the verge of a collapse. Indices could continue to go higher from here, and even if a few high flyers do get clipped, that doesn’t mean that the rest of the economy will be in trouble.

Our investment process favors patience. We focus our portfolios towards the cheaper segments of the market which have lagged. We look for reversion to the mean, investing as contrarians, rather than chasing momentum. Our value funds and REIT ETF had positive returns, but were detractors from performance, as was our allocation to Alternatives. However, I remain committed to these positions because they are relatively cheap. While they did not beat the market over the past 6 months, our rationale for holding them has only grown more compelling.

In fixed income, the US Aggregate Bond Index (iShares ticker AGG) was up 2.40% year to date. Our fixed income allocations were ahead of AGG by 30 to 80 bps, with higher yields and lower duration. Our position in Emerging Market bonds was a standout performer for the half. I continue to keep a close watch on high yield bonds, but overall think we are well positioned for today’s economy and potential future rate hikes.

I write about the markets twice a year, and not more frequently, to not distract us from sticking to a long-term allocation. We focus on what we know works over time: diversification, keeping costs low, using index funds for core positions, and tilting towards value. Our discipline means that we don’t let short-term events pull us away from our strategy.

Looking at the first half, our fixed income and international equity holdings did quite well. Our value and alternatives holdings have not yet had their day in the sun. However, if the market does eventually realize that the US tech stocks have gotten “irrationally exuberant”, I think we will be glad we have our more defensive positions.