Extend Your Car Warranty for Free

When it comes to saving money, there are two expenses which will make or break your budget: your home and your cars. If you keep those expenses below your means, you will have a surplus to save and invest. That’s how you generate wealth. 

Unexpected car repairs are the worst. You can spend thousands and it feels like you are just flushing your money away. That’s why we love car warranties: they help extinguish our fear of repair bills. For a lot of people, when their car warranty runs out, they want to get a new car because they can’t stand the thought of a catastrophic repair bill. 

But buying a new car every three or four years exposes you to the steepest part of the depreciation curve. Most cars will lose 50 to 60 percent of their value within five years. Owning new cars is trading the mere possibility of car repair bills, which might not happen, for the certainty of significant depreciation, which is inevitable.

Of course, car dealers would love to sell you an extended warranty. It’s one of their most profitable areas. That alone makes me think they are not worth it. You are spending $2,000 to buy a $1,000 warranty. And the insurer probably only pays out 50 to 80 cents in claims for every dollar in premiums it receives. It seems like you would be betting against yourself. 

I don’t usually endorse products or services here in my newsletter, but I came across a benefit which I think many of my readers might enjoy. It’s a way to provide protection against unexpected car repairs. This might allow you to keep your vehicles for longer and then direct more savings into your investment portfolios. (Selfishly, I will make more if my clients have larger investment portfolios, but hopefully that’s a goal we can both agree on!)

There is a company called BG Products which makes fluids for cars and trucks. They make motor oil (including synthetic), transmission fluid, brake fluid, anti-freeze/coolant, steering fluid, etc. BG offers a Lifetime Protection Plan that when you use their product regularly, if that component breaks down, they will reimburse you for the cost of the repair, up to a specific limit.

Best of all, they will cover your car, even if you don’t start using their fluids until 50,000 or 100,000 miles. That means that if you have a car with 80,000 miles, past the manufacturer’s warranty, you can actually add protection to your vehicle today. They offer double the protection if you start before 50,000 miles, so you might want to start sooner if you can. 

There is no limit on miles. As long as you continue to change the fluids within the specified number of miles, your car will be covered. You could keep your car for 300,000 miles and it would still be protected.

Here are the service intervals required for the Lifetime Protection Plan. If your manufacturer suggests more frequent changes, I would follow those instructions. To stay under this protection plan, you need to replace fluids before reaching these limits.

Engine Oil: 10,000 miles

Coolant: 30,000 miles

Transmission Fluid: 30,000 miles

Power Steering: 30,000 miles

Brake Fluid: 30,000 miles

The BG plan will reimburse repairs if these components break, but not for normal wear and tear. You would have to get the repairs done and then submit your receipts for reimbursement, which are subject to the following limits:

Plan 1, started before 50,000 miles: $4,000 coverage

Plan 2: started between 50,001 and 100,000 miles: $2,000 coverage

Full details of covered components HERE.

BG Products are not available in stores, you have to find a shop which uses them. Here in Dallas, I have used M2 Auto Repair, near Love Field. I’ve had a great experience there and can recommend them. If you talk to Eddie, the owner, please tell him I sent you.

If you’re not in the Dallas area, you can find a BG Dealer here. I have not filed a claim with BG, so I cannot vouch for that process, but obviously it is going to be very important to be able to document that you did have the services performed within the mileage limits and that the repairs required were on the specific parts covered by the protection plan. 

It doesn’t cover electronics, which is an increasingly large component in modern cars, but can give you some peace of mind over mechanical failures. If you’ve used BG and had a claim, please send me an email and tell me about your experience. 

I am aware that other fluid makers offer warranties, including Mobil 1, Castrol, and Valvoline. In reviewing their warranty pages, they may offer similar benefits, but I think it may be more difficult to document proof of eligibility, and they don’t cover all of the systems that BG Products covers.

I’d also love to hear from you if you have ever filed a claim with another oil company and what result you received.  Regular maintenance is an important part of keeping your car healthy, and it’s great to see a company stand behind its products. I’m no expert on cars, but I have spent a lot of time looking at spending behavior. Any techniques which can help us spend less over the life of our vehicles will help you achieve your other financial goals. So, even if you don’t end up using the Lifetime Protection Plan, just knowing you were covered may provide you with the extra confidence to keep you car for 150,000 or 200,000 miles.

The Persistence Scorecard

As investors begin reviewing their year-end 2018 statements for their 401(k) and other accounts, I know many will want to change funds after a disappointing year. What do investors do? If they have 15 funds available in their plan, they will often sell out of their lagging fund and put money into whichever funds are performing best.

It seems rational enough to believe that a fund manager who is doing well might have above average skills, work harder, or have a better team than other fund managers. That’s why many investors switch funds – in the assumption that an excellent track record is evidence that strong performance will continue. 

You should care about your funds and their managers. But the reality is that switching funds for better performance is not a slam dunk. In December, Standard and Poor’s released their semi-annual Persistence Scorecard. I hope you will read this report. It may change how you invest, how you select funds, and the reasons why you would switch from one fund to another.

In the Scorecard, S&P analyzes returns of over 2,000 US mutual funds, to determine whether high performing funds continue to have strong performance. They evaluate funds by quartile, with data through September 30, 2018. The top 25% of funds would be called first quartile and the worst 25% of funds would be the fourth quartile.

When you buy a fund in the top quartile, what is the likelihood that it will stay a top performer? Let’s go back to September 2016 and track the 550 domestic equity funds that were in the top 25% for the preceding one-year period. Only 21.09% of the top quartile funds stayed in the top quartile in the next year, ending September 2017. And only 7.09% of the 2016 top quartile funds managed to stay in the top quartile for both 2017 and 2018. Of the funds in the top 25% in 2016, only one in thirteen would stay in the top quarter for the next two years.

When you buy this year’s top funds, it is very unlikely that those funds will continue to be the best performers in the subsequent years. Even though we have all heard that “past performance is no guarantee of future results”, everyone still wants to buy the 5-Star fund, even though all that rating tells us is the fund’s most recent performance!

Perhaps you knew better than to put much weight on one year performance. Still, wouldn’t a good manager be able to create a nice long-term track record? The Scorecard also looks at three and five-year returns.

Let’s consider the five-year data:

We will go back to September 2013 and track the 497 funds which were in the top quartile for five-year performance. How did they do over they following five years, through September 2018?

Only 27.16% would stay in the top quartile for another five years. 21.73% would fall to the second quartile, 20.32% would fall to the third quartile, and 21.13% would end up in the bottom quartile. Additionally, 9.46% of the top funds in 2013 would not even exist five years later. Fund companies merge or liquidate their worst performing funds to make their track records disappear. That’s right, when you go on Morningstar and look up funds, what you see is the result of Survivorship Bias. The record has been cleansed of the worst offenders and you only see the survivors. Thankfully, S&P keeps all data and includes deleted funds in its study.

To me this is another reason to use index funds rather than active managers. There is little evidence that when you pick a top performing manager that he or she will persist as a top performer. In fact, there is about only a one-in-four chance a top fund will remain in the top quartile. That’s pretty much a roll of the dice. Switching from one active manager who is underperforming to another active manager who was recently outperforming is very unlikely to be a successful strategy.

Instead of focusing on manager selection and risk chasing performance, we take a more structured approach:

1. Start with the overall asset allocation. Your weighting of stocks and bonds (60/40, 70/30, 50/50, etc.) is the largest determinant of your portfolio risk and return in the long run.

2. Determine how much you want in each category, such as US Large Cap, US Small Cap, US Value, International, Emerging Markets, etc. We base this on correlation, risk and return profiles, and diversification benefits. Then, we adjust the weightings towards categories which we feel are presently undervalued relative to the others.

3. Choose funds which closely reflect those categories. If you are buying a mid-cap fund, it should act like a mid-cap fund. 

4. Expenses matter. According to research from Morningstar: “the expense ratio is the most proven predictor of future fund returns.” We prefer funds with low expenses so you can keep more of the performance you are buying.

5. While we could use actively managed funds, we like the track record of index ETFs, along with their low cost, tax efficiency, and transparency. They are great building blocks for a portfolio.

Being diversified means owning a broad basket of holdings. This can be frustrating sometimes, wondering why you own A instead of B, when A is down this year and B is up. But putting all your money into whichever category or fund is doing best at any one point in time is not an effective strategy. That’s not just my opinion – look at the data from Standard and Poor’s Persistence Scorecard and I think you will reach the same conclusion. Bet on the market, not the manager.

Storm Clouds Gathering

Being an investor requires the humility to acknowledge that no one has a crystal ball and we cannot control the future. I find it best to ignore predictions and forecasts and to tune out day to day news, especially from “experts”. It’s just noise that distracts us from our process. There are always Bulls and Bears, so we run the risk of Confirmation Bias, embracing evidence that conforms to our beliefs and disregarding arguments that differ.

The current Bull Market is nine years old and there have been ample reasons for several years to think that we are in the late innings of this expansion. But anyone who has tried to time the market over the past decade has almost certainly hurt their returns rather than enhanced them.
Over the past two weeks, we’ve observed two significant economic signals which like the proverbial “canary in the coal mine” have been strong predictors of past Bear Markets. Because of their rarity and historical significance, I think investors should consider these signals with more weight than opinions, forecasts, or projections.

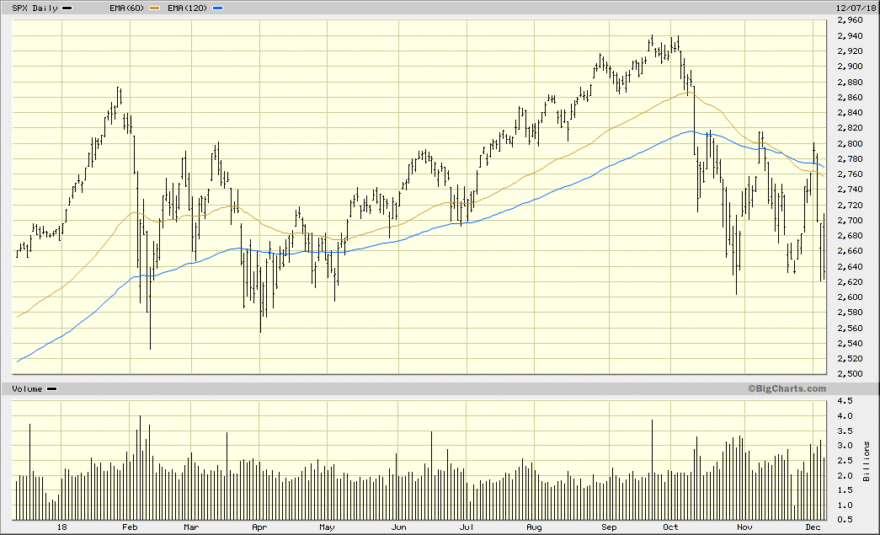
1. The crossover of the Equity Circuit Breaker. We’ve described this technical analysis previously, but here is a quick review: We look at the S&P 500 Index and calculate Moving Averages based on the previous closing prices of the past 60 and 120 days. That is each day, we look back at the previous 60 and 120 days. When the market is in an uptrend, the 60 day moving average stays above the 120 day average and both lines are sloping upwards. 

In a Bear Market, a prolonged downturn, the 60 day moving average is below the 120 day average and both are sloping down. The signal occurs when these two lines crossover; this reflects a potential change in regime from an up market to a down market. Because we are looking at longer averages – 60 and 120 days – this analysis usually tunes out brief market panics of a month or two. A crossover occurred this year at the end of November.  

This crossover was a good predictor in past Bear Markets; it would have gotten you out of stocks very early in the 2008 crash and back into stocks in the Fall of 2009. However, it can give false positives. Back in 2016, we also had a crossover occur for several months. That year, if you had traded on the crossovers, you would have gotten out at a loss and then had to buy back into stocks several percentage points higher.

2. Yield Curve Inversion. Typically, longer-dated bonds pay higher interest rates than shorter bonds. This week, however, we briefly saw the five-year Treasury Bond trade at a lower yield than the two-year Treasury, an inversion of the normal upwards slope of the yield curve. 

Why should you care? A Yield Curve Inversion has been a good predictor of previous recessions. This shows that investors are bidding up five-year bonds, preferring to tie up their money for longer, seeing a lack of short-term opportunities elsewhere. It also reflects a belief that interest rates may fall.

Past Yield Curve Inversions have occurred in 1978, 1988, 1998, 2000, 2005-2006. In each case, except for 1998, a recession took place within a year or two. So it does not have a 100% track record of accuracy either, but it is a rare enough of an event that I think it is worth our very careful consideration. The seven previous recessions all were preceded by a yield curve inversion.

Read More: from Bloomberg, “The US Yield Curve Just Inverted. That’s Huge.”

Over the past several years, when people asked me what it would take for me to become concerned about a Bear Market, I would have told them these two things: a crossover of the moving averages and a yield curve inversion. Both have been good (but not perfect) predictors of past Bear Markets and Recessions. And both have occurred since Thanksgiving this year.

The market may continue to go up in 2019, so I cannot assume anything with certainty. Still, I am concerned enough about these two signals that we are going to be slightly reducing our equity exposure and risk levels for our 2019 models. This is a temporary, tactical move and we will look to move back to our target equity weighting either when we feel that prices are significantly distressed, or after the moving averages have crossed back upwards. We are not going 100% to cash; at this point, we are considering reducing equities by 20%, pending further analysis this week.

We will be making necessary trades on a household by household basis before January 1, making sure we minimize any possible tax liabilities. We will look to harvest losses in taxable accounts and to try to avoid creating gains except in IRAs. 

While there’s no guarantee these trades will be profitable, I take these two signals seriously enough that I feel compelled to act and will be doing the same trades in my own portfolio. If we do have a prolonged Bear Market, we may wish to have sold even more. However, I want to balance that risk with the fact that these signals could be wrong this time. Perhaps the market continues up for another year or two before there is a recession and we miss out on significant further gains.  

Investors were not at all successful at timing the market back in 2007-2009, even though with the gift of hindsight, we might think it will be “easy” to see and act next time around. My goal remains to create effective, diversified portfolios that are logical, low cost, and tax-efficient. Making tactical adjustments to reduce risk and hopefully enhance returns is what clients expect from me, but we do not make these changes lightly. If you have questions about your portfolio, or want to talk in more detail about these signals, or the economy, I am always happy to have a conversation about what we can do for you.

Roth Conversions Under the New Tax Law

Everybody loves free stuff, and investing, we love the tax-free growth offered by a Roth IRA. 2018 may be a good year to convert part of your Traditional IRA to Roth IRA, using a Roth Conversion. In a Roth Conversion, you move money from your Traditional IRA to a Roth IRA by paying income taxes on this amount. After it’s in the Roth, it grows tax-free.

Why do this in 2018? The new tax cuts this year have a sunset and will expire after 2025. While I’d love for Washington to extend these tax cuts, with our annual deficits exploding and total debt growing at an unprecedented rate, it seems unavoidable that we will have to raise taxes in the future. I have no idea when this might happen, but as the law stands today, the new tax rates will go back up in 2026.

That gives us a window of 8 years to do Roth conversions at a lower tax rate. In 2018, you may have a number of funds which are down, such as Value, or International stocks, or Emerging Markets. Perhaps you want to keep those positions as part of your diversified portfolio in the hope that they will recover in the future.

Having a combination of both lower tax rates for 2018 and some positions being down, means that converting your shares of a mutual fund or ETF will cost less today than it might in the future. You do not have to convert your entire Traditional IRA, you can choose how much you want to move to your Roth.

Who is a good candidate for a Roth Conversion?

1. You have enough cash available to pay the taxes this year on the amount you want to convert. If you are in the 22% tax bracket and want to convert $15,000, that will cost you $3,300 in additional taxes. That’s painful, but it saves your from having to pay taxes later, when the account has perhaps grown to $30,000 or $45,000. Think of a conversion as the opportunity to pre-pay your taxes today rather than defer for later.

2. You will be in the same or higher tax bracket in retirement. Consider what income level you will have in retirement. If you are planning to work after age 70 1/2 or have a lot of passive income that will continue, it is entirely possible you will stay in the same tax bracket. If you are going to be in a lower tax bracket, you would probably be better off not doing the conversion and waiting to take withdrawals after you are retired.

3. You don’t want or need to take Required Minimum Distributions and/or you plan to leave your IRA to your kids who are in the same or higher tax bracket as you. In other words, if you don’t even need your IRA for retirement income, doing a Roth Conversion will allow this account will grow tax-free. There are no RMDs for a Roth IRA. A Roth passes tax-free to your heirs.

One exception: if you plan to leave your IRA to a charity, do NOT do a Roth Conversion. A charity would not pay any taxes on receiving your Traditional IRA, so you are wasting your money if you do a conversion and then leave the Roth to a charity.

The smartest way to do a Roth Conversion is to make sure you stay within your current tax bracket. If you are in the 24% bracket and have another $13,000 that you could earn without going into the next bracket, then make sure your conversion stays under this amount. That’s why we want to talk about conversions in 2018, so you can use the 8 year window of lower taxes to make smaller conversions.

2018 Marginal Tax Brackets (this is based on your taxable income, in other words, after your standard or itemized deductions.)

Single Married filing Jointly
10% $0-$9,525 $0-$19,050
12% $9,526-$38,700 $19,501-$77,400
22% $38,701-$82,500 $77,401-$165,000
24% $82,501-$157,500 $165,001-$315,000
32% $157,501-$200,000 $315,001-$400,000
35% $200,001-$500,000 $400,001-$600,000
37% $500,001 or more $600,001 or more

On top of these taxes, remember that there is an additional 3.8% Medicare Surtax on investment income over $200,000 single, or $250,000 married. While the conversion is treated as ordinary income, not investment income, a conversion could cause other investment income to become subject to the 3.8% tax if the conversion pushes your total income above the $200,000 or $250,000 thresholds.

You used to be able to undo a Roth Conversion if you changed your mind, or if the fund went down. This was called a Recharacterization. This is no longer allowed as of 2018 under the new tax law. Now, when you make a Roth Conversion, it is permanent. So make sure you do your homework first!

Thinking about a Conversion? Want to reduce your future taxes and give yourself a pool of tax-free funds? Let’s look at your anticipated tax liability under the new tax brackets and see what makes sense your your situation. Email or call for a free consultation.

Investing for Good

Four years ago, I wrote about Socially Responsible Investing (SRI) in this blog. SRI is investing in companies based on an assessment of their Environmental, Social, and Governance policies, or ESG. In 2014, SRI funds had just passed $100 Billion in assets and have since grown twenty-fold to over $2 Trillion globally.

At that time, I had reservations that SRI funds carried a number of pitfalls, including weak diversification, high expense ratios, and poor performance. I discussed one of the original SRI exchange traded funds, KLD, which in 2014 had an expense ratio of 0.50%.

Things have changed for the better. Today we have new SRI funds which are better diversified and have reduced tracking error versus a core Index-based ETF like we normally suggest. Expense ratios have fallen dramatically, with some SRI funds as low as 0.15% to 0.20%, which is much more competitive with traditional ETFs.

With these newer funds, I think we can now say that investing using SRI principles should have similar performance to our traditional portfolios. I don’t know that the performance will be any better, but I no longer am concerned that SRI will automatically condemn you to under-performing a non-SRI approach today.

For the first time, we have the tools to create a globally diversified portfolio of SRI funds which are low cost, transparent, and rules-based. What is lacking, however, is a long track record: of the 38 or so SRI ETFs available to US investors today, about half are less than two years old. This requires extra research and due diligence to understand what you are actually buying and how the fund might perform in different market environments.

For a lot of investors, we want to invest in companies which do good, and not the ones who pollute the environment, support dictators, sell tobacco, or treat their employees, customers, or shareholders with callous disregard. That’s the appeal of SRI; it aligns our money with our values.

When you invest in an index fund, you own all the stocks in a benchmark, including some which maybe you’d rather not own. With the proliferation of index investing, the largest shareholders of many companies are often Vanguard and Blackrock, the two largest index fund providers.

Although index funds vote on behalf of shareholders, they have largely voted in favor of management proposals. Indexers cannot sell their shares if a company is doing bad things. If it’s in the index, the fund has to own it. This weakens the role of shareholders as owners and beneficiaries of corporate decisions and the accountability of executives to shareholders.

I see a beneficial role for SRI investors within capitalism because they tell company executives and boards that they have to do better on ESG criteria or we will not invest in their company. To that extent, I believe we are already seeing improved corporate behavior thanks to SRI investors including ETFs, activist funds, and large pension plans such as CalPERS.

Are you interested in Socially Responsible Investing? Would you like to see what your portfolio might look like if we used SRI funds instead of traditional Index ETFs? We do not want to sacrifice performance, which is why we have been cautious about adopting SRI funds. But with better diversification and lower expense ratios, today’s SRI funds are significantly improved. Let’s talk about how we might implement SRI for you.

You CAN Invest in a Taxable Account

I spend a lot of time talking about retirement accounts, and for many Americans, the only stocks they will ever own are in their 401(k) and IRAs. I don’t know why, but many have never even considered investing outside of a retirement account, and a few have even thought it was not possible.

It is a GREAT idea to invest outside of your retirement accounts. Why? Because the contribution limits are so low for IRAs ($5,500) and 401(k) accounts ($18,500). There are a lot of people who put in that amount and then think they can’t do any more investing or that they don’t need to. There’s nothing magical about these amounts. No one is promised that if you save $5,500 a year into an IRA that you will have enough to retire (especially if you are getting a late start). And if you have ambitions to be wealthy, it may take you 30 or 40 years of 401(k) contributions to break the $1 million mark.

While we often talk about the tax benefits of retirement contributions, let’s actually run through the math of an IRA investment and making the same investment in a taxable account. The results may surprise you.

Let’s say you put in $5,000 to a Traditional IRA this year and also deposit $5,000 into a taxable account. In each account, you buy the same investment, such as a S&P 500 ETF, and hold it for 20 years until retirement. Assuming you get an 8% annualized return for those 20 years, in both accounts, your position would have grown to $23,304.79.

At the 20 year mark you withdraw both accounts. What taxes are due?

From the Traditional IRA, the entire withdrawal is treated as ordinary income. You may be in the 24% tax bracket, in which case you would owe $5,593.15 in taxes. That’s pretty painful and the reason why so many retirees hate taking money out of their IRAs and limit their withdrawals to their Required Minimum Distributions.

What about for the taxable account? You started with a $5,000 cost basis, so your taxable gain is $18,304.79. It is a long-term capital gain (more than one year), and will be taxed at the capital gains rate of 15%. Your tax due is $2,745.72. That’s less than half of the tax you’d pay on the withdrawal from the retirement account that you did for the “tax benefit”. Is that IRA a scam?

No, because you also got an upfront tax deduction for the IRA contribution. If you were in the 24% bracket, you would have saved $1,200 in taxes for making that $5,000 contribution. If you subtract the $1,200 in tax savings from $5,593, you still see that your net taxes paid was quite high: $4,393.

However, that is ignoring the time value of money and getting to save that $1,200 now. If you actually invest the $1,200 you saved that year, and have it grow at 8% for 20 years, guess what it grows to? $5593.15. (If you invested this in a retirement account, you will owe 24% in taxes on this gain, or another $1342.)

The key to coming out ahead with doing an IRA versus a taxable account is that you need to actually invest the tax savings you receive in year one. If you just consume that tax savings, instead of saving it, you actually might have been better off instead doing the taxable account where you could receive the lower capital gains rate.

The best solution is to maximize your retirement accounts AND save in a taxable account. If you want to become a millionaire in 10 years, save $5,466 a month. People have ambitious finish lines, but don’t set savings goals that are in line and realistic with their goals. The short-term activity has to match the long-term objectives. Once you are in retirement, it is a great benefit to have different types of accounts – IRAs, Roth, and taxable – to manage your tax liability.

My point is: Don’t be afraid of a taxable account. Retirement accounts are good, but mainly if you are going to save the upfront tax benefit you receive! Today’s ETFs are very tax efficient. While you will likely have dividend distributions of about two percent a year in a US equity ETF, when you reinvest those dividends, you are also increasing your cost basis. If you’re looking to invest in both a retirement and taxable account, let’s talk about how you can do this in the most effective way possible.

Specified Service Professions and the QBI Deduction

This year, there is a new 20% tax deduction for self-employed individuals and pass through entities, commonly called the QBI (Qualified Business Income) deduction, officially IRC Section 199A. While most people who file schedule C will be eligible for this deduction, high earners – those making over $157,500 single or $315,000 married – will see this deduction phased out to zero, if they are in a Specified Service Trade or Business (SSTB).

See: FAQs: New 20% Pass-Through Tax Deduction

Professions that are considered an SSTB include health, law, accounting, athletics, performing arts, and any company whose principal asset is the skill or reputation of one or more of its employees. That’s pretty broad.

Some business owners may have income that is from an SSTB and other income which is not. For example, consider an eye doctor who has a business manufacturing glasses. If she performs an eye exam, clearly she is working in an SSTB as a health professional. If she is manufacturing glasses, that might be a different industry.

This possibility of splitting up income into different streams has occupied many accountants this year, to enable business owners to qualify for the QBI deduction for their non-SSTB income. Since this is a brand new deduction for 2018, this is uncharted territory for taxpayers and financial professionals.

In August, the IRS posted new rules which will greatly limit your ability to carve off income away from an SSTB. Here are some of the details:

  • If an entity has revenue of under $25 million, and received 10% or more of its revenue from an SSTB, then the entire entity is considered an SSTB. If their revenue is over $25 million, the threshold is 5%
  • An endorsement (by a performing artist, for example), or use of your name, likeness, signature, trademark, voice, etc., shall not be considered a separate profession. If you are in an SSTB, an endorsement shall also be considered part of the SSTB.
  • 80/50 rule. If a company shares 50% or more ownership with an SSTB, and receives at least 80% of its revenue from that SSTB, it will be considered part of the SSTB. So, if our eye doctor who makes glasses only makes glasses for her own practice, then it will be considered part of her SSTB. If the manufacturing business has at least 21% in revenue from other buyers, then it could be considered a separate entity and qualify for the QBI deduction.

Business owners in the top tax bracket of 37% for 2018 (making over $500,000 single or $600,000 married), might be considering forming a C-corporation if they are running into issues with the SSTB. While a C-Corp is not eligible for the QBI deduction, the federal income tax rate for a C-Corp has been lowered to a flat 21% this year.

Of course, the challenge with a C-Corp is the potential for double taxation: the company pays 21% tax on its earnings, and then the dividend paid to the owner may be taxed again from 15% to 23.8% (including the 3.8% Medicare surtax on Net Investment Income.)

Still, there may be some benefits to a C-corp versus a pass-through entity, including the ability to retain profits, being able to deduct state and local taxes without the $10,000 cap, or the ability to deduct charitable donations without itemizing.

If you have questions about the QBI Deduction, the Specified Service Business definition, or other self-employment tax issues, we can help you understand the new rules. We want to help you keep as much of your money as possible, but you can’t wait until next April and then hope you can do something about 2018.

Financial Planning In Your Sixties

Investors in their sixties are in a decade of decisions. Up to this decade, you could do very well by putting your saving on autopilot, and doing little more for your portfolio than occasionally rebalancing it. Now, you’re faced with some important decisions, whether you are planning to retire soon or to wait many years down the road.

See: Six Steps at Age 60

1. Social Security. The decision of when to start receiving your Social Security benefits is independent from when you retire from your job. The Full Retirement Age (FRA) today is 66, but you can start early benefits from age 62 on. Or you can delay past FRA, all the way to age 70, and receive an 8% annual increase in benefits for waiting.

Where else can you get a guaranteed 8% increase in benefits? It’s a great deal to wait, even if it requires that you spend down some of your cash. Guaranteed benefits are the best way to offset longevity risk, so maximizing your Social Security can be a great idea if you are healthy and have a family history of long lives. For married couples, there is a survivor’s benefit, which means that the spouse with the higher benefit has essentially a joint benefit. There are a lot of things which people don’t consider about Social Security, and that’s why it’s best to talk to me first.

See: Social Security, It Pays to Wait
See: Guaranteed Income Increases Retirement Satisfaction
See: Social Security Planning: Marriage, Divorce, and Survivors

2. Health Care. Medicare starts at age 6r5. If you retire before 65, you will have to figure out how you will be covered until age 65. And when you do reach age 65, you will sign up for part A, and probably Part B (unless you have proof of employer coverage), and will then need to consider whether a Medicare Supplement or Advantage plan makes sense for you. Again, lots of decisions here, and if you don’t sign up at your “window” at age 65, you may have to pay permanent penalties on Part B when you do enroll.

See: Types of Medicare Health Plans

3. Retirement Age. The most dangerous thing I can hear is “It’s okay, I don’t plan to retire.” There are so many people in their sixties who planned to work for another decade or more and things didn’t work out as planned. Maybe they were laid off, or had a health situation, or their spouse had a health issue, or their employer asked them to relocate. Things change. We can’t assume that we have the ability to maintain the status quo indefinitely by choice. My goal for every sixty-something client is that you work because you want to and not because you have to. So even if your planned retirement age isn’t until sometime after 75, make sure you and your family will be all set financially if you decide to retire earlier.

See: How Much Income Do You Need In Retirement?

4. Withdrawal Strategies. If you are retiring and starting withdrawals from your accounts, you will need to make decisions about how much to withdraw and from which account or assets. If the market goes down, can you withdraw the same amount? What is the most tax efficient way to withdraw from your accounts?

See: Taxes and Retirement

5. Asset Allocation. We typically plan for a 20-30 year retirement period, so even if retirement is close, we are still investing for the long-term. Even so, we want to reduce market risk in the five years before retirement to mitigate the potential impact of a bear market right before you plan to begin withdrawals. After retirement has begun, there is evidence that it may be beneficial to sell your bonds first and not rebalance your portfolio. This would mean that your equity holdings would become a larger weighting in your allocation over time.

See: What Is The Best Way To Take Retirement Withdrawals?

Of course, there are many other decisions which we evaluate in a financial plan, such as whether to take a pension or a lump sum upon retirement. When you are facing these decisions, what you don’t know can hurt you. That’s where I can help you navigate these decisions whether you have already retired, are retiring soon, or have many years before you plan to retire.

How to Get Paid for Limit Orders

When we place an order for a stock or Exchange Traded Fund (ETF), there are a couple of ways we can make a purchase. The easiest is a Market Order, which simply instructs our custodian (TD Ameritrade Institutional) to purchase the specified number of shares at the current market price.

Sometimes, however, we may want to purchase shares at a lower price or wait until the market falls to a specific level. This can be achieved through a Limit Order – which says that we will buy our position only at or below a price we indicate. Of course, the challenge with a Limit Order is that there is no guarantee that the price will in fact fall to our target!

Many investors who use Limit Orders, especially in a Bull Market like we’ve had in recent years, see prices move up and their orders never fill. Then they are faced with the ugly choice of having to buy at a higher price than if they had just used a Market Order at the beginning. And instead of participating in the growth of the market, they sit on the sidelines in cash. So there can be a real opportunity cost to Limit Orders. In reality, Limit Orders are a type of market timing, where an investor thinks they can predict short term moves and profit from those fluctuations.

There is a third, more complicated option, which most investors don’t know how to do. Like a Limit Order, we can select a target price that we would like buy a stock or ETF within a certain time frame. And like a Limit Order, if the price falls to or below this level, we will buy the shares at our target price. Unlike a Limit Order, we can get paid for our willingness to buy these shares, regardless of whether or not the order fills, by using options.

It is done by selling a Put. A Put is an option which requires you to buy a security for a specific price (called the “strike price”) before or at the expiration of the option (typically one month to one year). When you sell a Put, you receive a premium upfront in exchange for agreeing to buy shares at the strike price. One options contract equals 100 shares.

Let’s walk through an example. You are looking to buy the iShares Emerging Markets Index, ticker EEM. As of the Friday August 17 close, you could have bought EEM at the market at $42.21. 100 shares would have cost $4,221. But maybe you thought it could go lower, so instead, you enter a Limit Order for $40. Now, if EEM falls to $40, you will buy your 100 shares for $4,000.

Alternatively, you could sell a November $40 Put on EEM for $83. That means you would get paid $83 in exchange for the right for someone else to make you buy 100 shares of EEM for $40 a share between now and November 16, 90 days from now. If EEM falls to $40 or below, you will buy 100 shares for $4,000 just like in the limit order, plus you made the $83. Even if EEM stays above $40, you keep the $83 no matter what.

I know that $83 isn’t much, it represents about 2% of the price of EEM. That’s over 90 days, so if we consider the value of selling this option on an annualized basis, it is a bit over 8% a year. That’s a lot better than using a limit order and not making anything.

Let’s consider the difference between a market order, a limit order, and selling a Put using two different scenarios, at 100 shares. Today’s price is $42.21 and I’m disregarding commissions and taxes in these examples.

1. The price rises to $45. If you bought at the market ($4,221), you would have a profit of $279. If you placed a limit order at $40, your order never filled and you have nothing. If you sold the put, you would not have any shares, but you would have the $83.

2. The price of EEM falls over time to $38 a share. If you bought 100 shares at the market ($4,221), your shares are now worth $3,800 and you are down $421. If you set a limit order at $40, you would have bought 100 shares for $4,000 and you are now down by $200. If you sold a put, you’d also buy 100 shares at $4,000, but since you collected the $83, you now have a lesser loss of $117.

So whether the price goes up or down, selling a Put is generally going to be better than a limit order. The only example where this might not occur is if a stock has a big gap down overnight – for example, it is at $41 one day and the next morning opens at $38. In this case, your limit order will fill at the open at $38. This does happen sometimes, but it is fairly unusual. Most limit orders, if they fill, end up being executed right at your limit price.

Who is taking the other side of the option? The buyer of a Put is likely a “hedger”: they are buying the Put as protection to preserve their money in case the stock goes down. Or they are a speculator who is betting that the stock will fall. Both are bad bets, statistically. When the expected return of the market is only 8%, paying an 8% annualized premium to hedge your position is in effect giving away all of your potential upside.

Instead, I’d rather be the person selling them this insurance and be the seller of the Put. I’ve spent may years selling Puts (and Calls, too) and am not recommending this is something you try to do on your own. Not every stock or ETF has an active options market and you should be very careful with thinly traded options.

But this is a strategy we use with some of our clients in place of Limit Orders and I wanted to share with all of you an very brief overview of how it works. Please note that options are only available on securities which trade on the exchange and not on mutual funds. What I do not recommend is selling Puts as a speculative bet. Only sell Puts for shares you want to buy and own as a long-term investment. Additionally, to sell Puts, you must either have either cash in the account or a margin account. If you’re interested in learning more about selling Puts in place of limit orders, please reply to this email.

Note: accounts must be approved for options before trading can begin. Please see The Characteristics and Risks of Standardized Options for more information.

Increase Returns Without Increasing Your Risk

In theory, Return and Risk are linked – you cannot get a higher rate of return on an asset allocation without taking more risk. However, portfolios can be inefficient and there are a number of ways we can improve your return without adding risk or changing your asset allocation. Here are five ways to increase your returns:

1. Lower Expense Ratios. Many mutual funds offer different “share classes” with different expense ratios. The holdings are the same, but if one share class has 0.25% more in expenses, those shareholders will under perform by 0.25% a year. Here at Good Life Wealth Management, we have access to Institutional shares which have the lowest expense ratio. Generally, these funds are available only to institutions or individuals who invest over $1 million. We can buy these shares for our investors, without a minimum, which frequently offer savings of 0.25% or more versus “retail” share classes.

2. Increase your Cash Returns. If you have a significant amount of cash in your holdings, make sure you are getting a competitive return. Many banks are still paying 0% or close to zero, when we could be making 1.5% to 2% elsewhere.

3. Buy Treasury Bills. If you have a bond mutual fund and it charges 0.60%, that expense reduces your yield. If the bonds they own yield 2.8%, subtracting the expense ratio leaves you with an estimated return of 2.2%. Today, we can get that level of yield by buying Treasury Bills, such as the 26-week or 1-year Bill, which have a short duration and no credit risk. If you are in a high expense bond fund, especially a AAA-rated fund, it may be preferable to own Treasury bonds directly and cut out the mutual fund expenses. We participate in Treasury auctions to buy bonds for our clients.

4. Buy an Index Fund. If you have a large-cap mutual fund, how has it done compared to the S&P 500 Index over the past 5 and 10 years? According to the S&P Index Versus Active report, for the 10-years ended December 2017, 89.51% of all large-cap funds did worse than the S&P 500 Index. Keep your same allocation, replace actively managed funds with index funds, and there’s a good chance you will come out ahead over the long term.

5. Reduce Taxes. Two funds may have identical returns, but one may have much higher capital gains distributions, producing higher taxes for its shareholders. If you’re investing in a taxable account, take some time to look at the “tax-adjusted return” listed in Morningstar, under the “tax” tab, and not just the gross returns. Even better: stick with Exchange Traded Funds (ETFs) which typically have much lower or even zero capital gains distributions. This is where an 8% return of one fund can be better than an 8% return of another fund! We prefer to hold ETFs until we can achieve long-term capital gains, and especially want to avoid funds that distribute short-term gains. We also look to harvest losses annually, when they occur, to offset gains elsewhere.

How can we help you with your investment portfolio? We’d welcome the chance to discuss our approach and see if we would be a good fit with your goals.