

Extra Catch-Up for 2025

Extra Catch-Up Contributions for 2026

Summary: For 2026, the IRS increased retirement plan and catch-up contribution limits for participants age 50 and over. There are now age-based catch-up tiers and income-based Roth catch-up requirements under SECURE 2.0. Understanding these updates helps in planning retirement contributions and tax-efficient saving.


How Catch-Up Contributions Work

Age-50+ catch-up contributions allow individuals age 50 or older by year-end to contribute above standard deferral limits in qualified retirement plans (401(k), 403(b), and some 457 plans) and IRAs. These extra contributions are designed to help older workers increase savings as retirement approaches.


2026 Contribution Limits

For tax year 2026, the IRS has updated limits and catch-up amounts as follows:

Employer-Sponsored Plans (401(k), 403(b), 457(b))

  • Standard deferral limit: $24,500
  • Age 50+ base catch-up: $8,000
  • Enhanced catch-up (ages 60-63): $11,250
    Total maximum when eligible: up to $35,750.

IRA Catch-Up Contributions

  • IRA contribution limit: $7,500
  • IRA age 50+ catch-up: $1,100
    Total IRA possible for age 50+: $8,600.

SIMPLE IRA Plans

  • Standard limit: $17,000
  • Age 50+ catch-up: $4,000
  • Enhanced (ages 60-63): $5,250 (for eligible plans)

New Roth Catch-Up Requirement in 2026

Under the SECURE 2.0 Act, beginning in 2026, higher-earning participants age 50+ must designate catch-up contributions as Roth (after-tax) once they exceed the regular deferral limit if their prior-year wages exceed a threshold (indexed; ~$150,000 for 2025 wages affecting 2026). This means such catch-up amounts are subject to taxation when contributed, not when withdrawn.

Why it matters: Some employers may require Roth catch-up contributions if plan design allows. If the plan does not support Roth contributions, some participants may not be able to take advantage of catch-up features.


Age-Based Catch-Up: Why It Matters

The IRS continues to recognize that workers closer to retirement often have a stronger need (and ability) to save more:

  • Age 50+ base catch-up: a general bump to allow additional contributions.
  • Age 60-63 enhanced catch-up: for those in their early 60s, acknowledging a shorter time horizon to retirement.

These age-based tiers remain even with the Roth designation rule for eligible higher earners.


Planning Considerations for Retirees

Tax Treatment

Traditional catch-up contributions have historically been pre-tax, lowering taxable income today. In contrast, Roth catch-up contributions are made after tax, meaning they wonโ€™t lower current taxable income but may grow tax-free in retirement if distribution rules are met.

Job and Wage Tracking

The ROTH-designation requirement is based on prior-year wages for the same employer. Changing jobs or varying wage sources may affect eligibility for pre- vs. after-tax catch-up contributions.

Interaction With Retirement Timing

Boosted catch-up limits can be useful for:


Frequently Asked Questions

Q: Do catch-up contributions count toward the annual limit?
Catch-up contributions are in addition to the regular elective deferral limit โ€” they do not reduce the base deferral maximum.

Q: When do I qualify for catch-up contributions?
You qualify if you are age 50 or older by December 31 of the tax year. For enhanced catch-up, you must be ages 60-63 in that year.

Q: Will catch-up contributions affect my RMDs?
No โ€” catch-up contributions impact saving limits but do not directly change Required Minimum Distributions (RMDs) or their timing. For discussion of RMD timing, see RMDs & Timing.

Q: Do SIMPLE IRA catch-ups work differently?
Yes โ€” SIMPLE IRAs have their own catch-up rules and limits. They follow similar age-based tiers but different numeric caps.


Related Reading


Catch-up contributions can meaningfully affect your long-term retirement savings strategy, especially when combined with tax and income planning decisions. If youโ€™d like a planning-first discussion of how the 2026 catch-up limits might fit into your personal retirement picture, youโ€™re welcome to Request an Introductory Conversation.

Hard Work Doesn't Create Wealth

Hard Work Doesn’t Create Wealth

When asked about their success, some wealthy people are quick to cite hard work as their key to success. I’m sure they have worked hard. But hard work doesn’t create wealth.

“Hard work” is a classic example of the correlation-causation fallacy. Wealthy people did work hard, but the vast majority of hard working people are not going to become wealthy. Instead, I want to talk about what really helps people to become wealthy: intention and process. Once those are in place, there may well be hard work, discipline, patience, and grit. Those are the fuel for creating wealth, but they are not the engine. The engine is creating intention and process.

Intention

Wealth is not an accident, it requires intention, financial literacy, and planning. When we are clear on our goals and values, our decisions start to become more aligned. My wealthy clients have made economic security a high priority. They focus on building a high income that supports their goals. Their intentions shape their education, careers, spending habits, personal vision, and other life-long decisions. Wealthy people have a wealthy mindset and focus on the following:

  • Living below your means. Most Americans spend 100% of their income. (Some spend more and go into debt.) If you can make frugal choices on your house, car, and leisure spending (especially eating out and vacations), you can place yourself in a situation where you can save a meaningful amount of money.
  • Delayed gratification. Your future self will thank you for the actions you take today. The more you can save today, the faster you may reach your finish line. Focus on increasing your income, not so you can spend more, but so that you can save more.
  • Understand things will not make you happy. We live in a consumer culture of materialism. There are too many people who are focused on appearing successful rather than being successful. Your home is not an investment, it is an expense.
  • Track your net worth, know your assets and liabilities. Have a plan. Most Americans spend more time planning a week of vacation than they do their entire future. Hoping you become wealthy is not a plan.
  • Start early. Compounding is amazing. Believe in the process and stick with it.

At retirement age, some investors will be millionaires. And they will work alongside people who have the same paycheck but who will retire with almost nothing. The successful made different decisions. They put in the maximum in their 401(k), not the minimum to get the company match. Their decisions reflected their intention to achieve financial success.

Process: Automatic Beats Hope

The process of becoming wealthy is simple. Save regularly over time and invest efficiently. It’s really not rocket science. The key is to make the process automatic. If you wait until the end of the year to fund your Roth IRA, you might not have an extra $7,000 lying around for you and your spouse. But if you set up monthly contributions of $583, you can achieve the same result. And then you don’t even have to think about it. Otherwise, if you are putting yourself in a position where you are hoping you can save, you are setting yourself up to fail.

  • Automate your contributions to your 401(k), IRA, 529 or other accounts. You can’t spend the money that is automatically contributed. Increase these contributions every year until you reach the maximum.
  • Don’t time the market. You will experience a Bear Market every 4-10 years. If you panic and sell everything, you cannot recover. In hindsight, every Bear Market (2000, 2008, 2020), was an amazing buying opportunity. Keep buying all the time. When you are young, you should love buying in a Bear Market.
  • Don’t aim to beat the market. In 20 years as a wealth manager, I’ve never met anyone who was wealthy because of their brilliant stock picks. The market does whatever it does. And what it has done over the years is fantastic and more than enough. Focus on what you can control: your savings rate. And then keep costs, taxes, and turnover low. Index funds work.
  • Be an optimist. You have to have some faith in the process. Not a blind faith, but the fortitude to stick with the plan when times are tough.

Things Always Change

America is the land of opportunity. We’ve never had a more level playing field than today for any American to become wealthy. Unfortunately, it is also becoming harder to get ahead. Many young adults face a tougher time than their parents in buying a house, paying off student loans, and being able to save. The wealth gap is widening and attaining economic security is becoming more challenging.

Even against that backdrop, it is still possible to become wealthy. Everyone wants to be a millionaire, but they have to first figure out how to get to $100,000. Once you’ve done that, getting to $200k and then $400k, is just a matter of time. Wealth creates more wealth. You build a savings muscle and establish your wealth engine, and then it just works for you.

Intention sets your focus and creates the decisions which enable you to save. Take control of your financial life and have a plan. Process is understanding what works and keeping your momentum headed in the right direction. Automate your savings and you remove yourself as the roadblock to your success. Neither intention nor process require hard work. They are a mindset.

You should work hard to develop your career and maximize your earnings. But that hard work won’t create wealth if you don’t have alignment on how your money can create your financial independence for you over time. Years from now, when a young investor asks about the cause of your success, I hope you can give the right answer. It was intention and process, not hard work, that created your wealth.

Related Retirement Income Topics
โ€“ Retirement Income Planning
โ€“ Guardrails Withdrawal Strategy
โ€“ Social Security: It Pays to Wait
โ€“ Required Minimum Distributions
โ€“ What Is a MYGA?

This topic is often part of a broader retirement or tax planning conversation. If youโ€™d like help applying these ideas to your own situation, you can request an introductory conversation here.

What is Survivorship Bias

What is Survivorship Bias?

Survivorship bias is the problem that the track record of today’s stocks reflects only the ones that survived. The stocks and funds which failed are no longer part of the performance history of today’s stocks or mutual fund databases. And as we will see, over the years, there have been a lot of stocks that have had bad returns and disappeared. We will also discuss how to invest wisely given the reality of survivorship bias.

Growing up in Rochester NY, my neighbor on the left worked for Eastman Kodak. Our neighbor on the right worked for Kodak. And all three neighbors across the street worked for Kodak. Kodak Park was the largest industrial site in the world, stretching for miles along Ridge Road. Rochester was a company town and there was tremendous pride in Kodak. The stock had done well for employees and residents, the company contributed a lot to the community, and the pension plan provided security to tens of thousands of retirees.

Kodak, the stock, was part of the S&P 500 Index and was one of 30 components of the Dow Jones Industrial Average from 1930 until April 2004. The company actually invented the digital camera in 1975, but thought it would be too impractical to ever have value. The rest, as they say, is history. The company had a long decline into obsolescence and filed for bankruptcy in 2012. The once mighty stock went to zero.

Stock Market 1926 through 2023

A new research paper by Hendrik Bessembinder looks at US stocks from 1926 through 2023, a 98-year period. During this period, there were a total of 29,078 US-listed stocks. Today, there are around 5,000. He looked at the performance of these stocks and it is a remarkable picture of Survivorship Bias.

  • Only 31 stocks have been in existence for the entire 98 years. The average stock existed only for 11.6 years. Approximately 24,000 companies have disappeared: either bankrupt, merged, acquired, or taken private.
  • 51 percent of the stocks had negative returns over their entire life, with a median compound cumulative return of -7.41%. Most stocks lost money!
  • Thankfully, the compounding effect of the winning stocks greatly offset the stocks which lost money. The mean performance is much better than the median performance of the 29,078 stocks.
  • If you randomly select 10 stocks from history, your chance of outperforming the S&P 500 is very small. That is because most of the wealth creation in the market comes from a small percentage of top-performing companies. The majority of stocks under-perform the index.

Idiosyncratic Risk

Eastman Kodak, Lehman Brothers, Enron, and General Motors all went bankrupt and their stocks went to zero. Even though the stock market has done well over the long-term, there are still many individual stocks that get destroyed. We call this Idiosyncratic Risk, or “company specific” risk. Unfortunately, even if you do your homework, investors risk being caught in the next Bear Stearns or Washington Mutual.

What can you do to address Survivorship Bias and reduce the Idiosyncratic Risk of individual stocks?

  1. Diversify extensively with index funds. While single companies do go bankrupt, we have never seen all 500 companies of the S&P 500 index go bankrupt at once. An index fund can greatly spread out your risk. Recognize the difference between speculating on an individual company versus investing in the market as a whole.
  2. Note that index funds are not static. Every year, the S&P 500 Index adds growing companies and drops other companies which are on their way down. Sure, there are still surprises where an S&P 500 company disappears suddenly (like Silicon Valley Bank last year), but you still have 499 other holdings.

Fund Shenanigans

It’s not just individual stocks that exhibit survivorship bias. Mutual Fund companies do the same thing, deliberately getting rid of their worst funds. A fund with a poor track record eventually gets so small that it is unprofitable, and the fund company shuts it down. Even more nefarious, companies create dozens of stock funds and then take the ones with a poor track record and roll them into their funds with better ratings. The crappy fund disappears and now it looks like all their funds are 4-star and 5-star funds!

You might think the solution is to avoid the mutual funds with a poor track record and go with a top ranked actively managed fund. Unfortunately, we know that performance is rarely consistent with actively managed mutual funds. Is that my opinion? No, this is what decades of data shows from the Standard and Poors Persistence Scorecard. For example, there were more than 2000 US stock mutual funds in December 2019. The top quartile (the top 25%) included 529 funds in 2019, but not a single one of those funds remained in the top quartile over the next four years, through December 2023. Past performance (you should know this by heart by now) is no guarantee of future results.

One of the consistent findings of the S&P Persistence Scorecard is that the worst performing funds are the most likely to merge or be shut down. And then you can’t find those one-star funds on Morningstar because they no longer exist. That’s survivorship bias. Our approach: use low-cost index funds from Vanguard, SPDRs, and others. Then we are not chasing performance, looking for the hot fund, sector, or country. And we have been saying for a long time: the vast majority of active managers under-perform their benchmark over time.

Keeping It Simple

The stocks which exist today are different from the ones from 98 years ago. Companies come and go. Survivorship Bias masks the poor track record of the many stocks and funds which have disappeared. When we only see the ones which survived and thrived, investing success looks easier and more inevitable than it really is. Unfortunately, there are stocks and funds out there today which will someday suffer the same fate as Eastman Kodak and thousands of other past stocks. Understanding this history will help you be a better investor in the decades ahead.

How can we reduce Idiosyncratic Risk or Survivorship Bias? Fortunately for investors, this complex question has a simple answer. We can diversify and reduce the importance of any one stock in our portfolio. With index funds, we get broad diversification, with hundreds or thousands of holdings, in a low-cost, tax-efficient vehicle. No doubt an index fund will own some stocks that fail, but one stock out of 500 may only move the index by 0.2% for one day. It often is hardly even noticed. And using index funds also helps keep us out of the worst actively managed funds, which sometimes were the best funds from five years ago. These are time tested strategies and the data keeps proving that this approach remains a wise choice for investors.

Bubble, Bubble Toil and Trouble

Bubble, Bubble Toil and Trouble

A bubble is brewing. The price of US Tech stocks has grown much faster than their earnings, fueled by the hype of AI transforming productivity and life as we know it. The comparison with 1999 is uncanny, but it’s not that investors have forgotten about the Tech Bubble. I think many are just hoping to make additional gains while momentum is leading these stocks higher.

We are going to look at valuations to put current prices in perspective. Today’s tech stocks have massive profits, unlike the cash-burning dot-com’s that went bankrupt in 2000. It’s great that these tech companies are doing so well, but that doesn’t mean that the price of their stock can never be too high. While the prices have not yet reached absurd levels, they are elevated enough to raise concerns about their sustainability.

Too Big?

Just how big have tech stocks gotten? The three largest stocks in the world are Nvidia, Apple, and Microsoft, all recently with values over $3 trillion, each. Let’s compare these three stocks to countries. Nvidia is worth more than all the stocks in Germany. All 489 German companies put together are worth less than Nvidia. Apple is worth more than all the stocks in the UK. Microsoft is worth more than all the stocks in France. Is each of these companies really worth more than the entire stock market of a major European economy? Apparently the market thinks so, but it is a remarkable disparity.

Nvidia added $1 trillion in market cap, going from $2 trillion to $3 trillion, in just 30 days. Compare this to Warren Buffet at Berkshire Hathaway. He is considered by many to be the greatest investor ever, and it took him 60 years to grow his company to a value of $875 billion. Nvidia grew that much in value in 30 days. Did they do something in 30 days that is worth more than the company Warren Buffet has built over 60 years? We will have to wait and see, but I’m a skeptic.

Value Matters

Today, Nvidia is trading for a Price/Earnings ratio of 65 times earnings, and 43 times the expected earnings of the year ahead. That is double the PE of the S&P 500 Index at 22 times earnings. And today’s S&P 500 is in the top 10% most expensive, historically. These companies will have to really maintain investor excitement, if the stocks are priced at double the market PE. The growth of these tech stocks has come from expanding the multiple – the P part of the PE ratio. The earnings, the E part of the PE ratio, needs to catch up. That could take years. I pick on Nvidia, but the story is similar for Microsoft, Meta, Amazon, Apple, Alphabet, and Tesla. All these are richly valued even though they are incredibly profitable.

After the 2000 tech bubble, many of the survivors took a decade to get back to their value at the peak. You may recall, this was called “the lost decade” in the stock market. I certainly hope this doesn’t happen again. But, today’s most expensive stocks could risk having disappointing returns for years to come. In the past, a PE of 23 often was a bull market peak valuation.

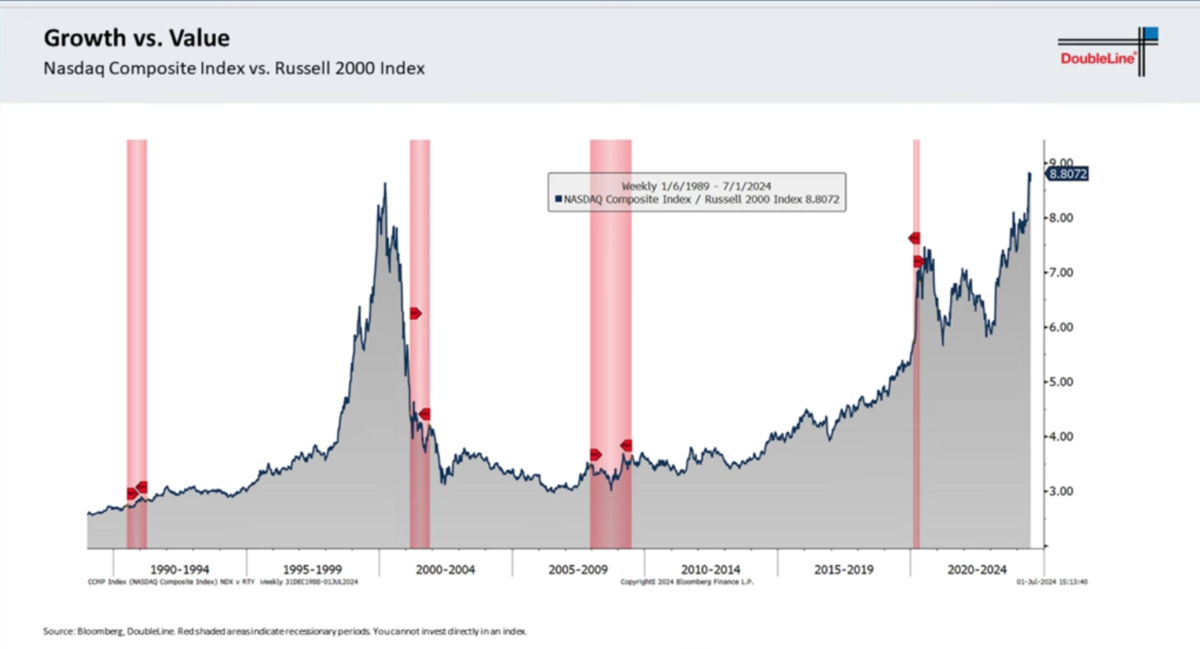
There are other categories which are not as overvalued as Tech. Consider the comparison of Growth Stocks (NASDAQ) versus Value Stocks (Small Cap Russell 2000), with this chart from DoubleLine. Today, the growth/value divide has actually exceeded the levels of 1999. To me this suggests there could be a reversion to the mean in the next couple of years, where growth lags and value finally does well.

Looking Ahead

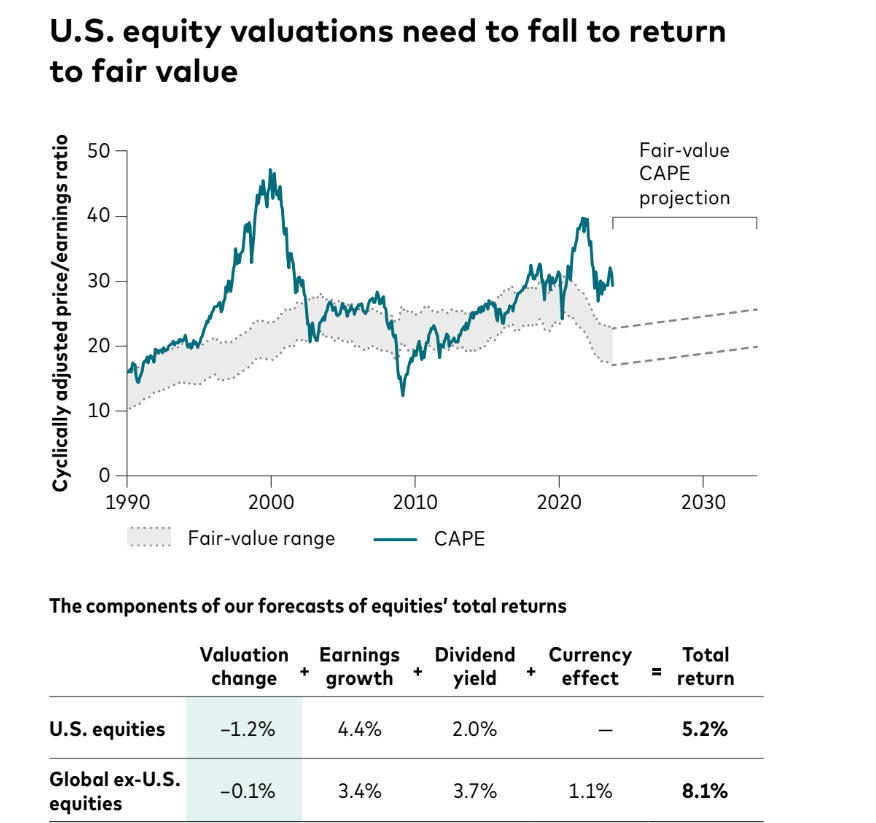
Investors spend too much time looking at the rear view mirror rather than forward through the windshield. Past performance is not indicative of future returns. And when a bubble occurs, it can take years to deflate. The stocks with the best past returns can do poorly, while the stocks with the worst recent returns may do better going forward. Consider the projected annual returns, for the next 10 years, from the Vanguard Capital Markets Model:

  • US Growth Stocks: 0.4% – 2.4%
  • US Value Stocks: 4.1% – 6.1%
  • US Small Cap: 4.3% – 6.3%
  • Foreign Developed Stocks: 6.7% – 8.7%
  • Emerging Markets: 6.0% – 8.0%

According to their calculation, you would be better off buying a 10-year US Treasury Bond (at 4.25% today), rather than owning US growth stocks over the next decade. Investors have been enjoying Tech growing at 20% a year, and now we are looking at an expected return of 1.4%. This is why we own value stocks, small cap, foreign stocks, and emerging markets in our portfolios. We are looking forward, not backward at past returns, when creating our models. We are diversifying into what we believe might be tomorrow’s winners rather than looking to concentrate into what has worked most recently.

Evidence Based Investing

We will see if today’s tech stocks have become an unsustainable bubble. These are really good companies which have enormous profits and are still growing at attractive rates. Even if there is not an abrupt bursting of the tech bubble, it is possible that growth segments will under-perform other categories over the years ahead. There is a strong rationale to be cautious about investing in stocks which have become very expensive.

Over the next month or year, growth stocks could continue to go up. Still, tech stocks could prove to be in a bubble which we see correct later. There might be an outside catalyst (think COVID, geopolitical event, debt crisis, recession, or something which no one had even considered), which causes a drop in the market. If this occurs, the most expensive stocks often sell off the most.

Tech stocks have become very large, quite expensive, and have a lower expected return than other stocks and many bonds. Our diversification allows us to both play defense today and also to own the categories with the highest expected return going forward. Don’t give up on Diversification!

The Risk of Distraction

The Risk of Distraction

Building wealth is a long-term process, a habit rather than a single event. Being a successful investor requires patience and determination, which can be challenging when there are so many distractions to drag us off course. 2024 is turning out to be an excellent year for investors, but there is so much uncertainty and negativity, it can be tough to maintain our focus.

Unfortunately, the more easily we are distracted from our plan, the more we are tempted to change direction with our investments. Tinkering with a long-term plan because of short-term thinking, often hampers returns rather than improves returns. The urgency of “don’t just sit there, do something!” can lead investors to do the wrong thing at the wrong time.

Election Years

This election cycle is certainly unusual and polarizing. Some people are excited about their candidate. Both sides insist there will be catastrophic consequences if their opponent wins. And, I think a lot of people are disappointed that with 340 million people in the US, these were the two best people we could find to run for president.

Yes, elections matter a great deal. The economy, taxes, laws and regulations, foreign policy, and many other things could get worse. But, change may be slow to come and could be reversed by a subsequent administrations. Regardless of who wins, a dysfunctional Congress seems likely to continue.

Nervous investors are starting to ask if they should change their portfolio or go to cash. We won’t be recommending that or making changes to our portfolio models based on the fact that it is an election year. Vanguard has found that markets performed well under both Republican and Democratic presidents, without a statistically significant difference. And election years, although volatile, had comparable returns to non-election years. (Actually slightly better, on average.) In other words, thinking about making big changes to your portfolio because of the election is likely to be a bad idea.

Behavioral Finance and Cognitive Biases

It can be difficult to stick with a long-term portfolio because we are wired to think about immediate dangers rather than growth over 10, 20, or 50 years. Our minds are incredible computers, but sometimes our mental shortcuts encourage decisions which are not in our best interest. The science of Behavioral Finance has categorized many of these cognitive biases. Even experienced investors have to guard against making decisions which distract us from our long-term wealth building process. For example,

  1. Herd behavior. Everyone else is buying Nvidia, so should you! You don’t want to miss out.
  2. Hot Hand Fallacy. Nvidia is up 154% over the past year, so it should continue to have fantastic returns.
  3. Recency bias. We focus on the performance of tech stocks over the past 12 months, and forget about the performance of tech stocks in 2000-2001. (People remember recent events better than past events.)
  4. Confirmation bias. You seek out evidence which supports your beliefs, but ignore other evidence which might challenge your beliefs.
  5. Hindsight bias. Looking back on past events and thinking that the outcomes were obvious and predictable.

And then there is the GI Joe Fallacy: the mistaken assumption that knowing about a bias is enough to overcome it. So, even if you know about cognitive biases, there is no guarantee that your thoughts are not being filtered through your biases. Hopefully, though, being aware of these biases can help you continually question your thought process and decisions.

Instead, Ask Yourself

Let’s reframe our five biases above into more rational questions or statements.

  1. Herd behavior: Is NVDA still a good value today or are there other stocks which might offer a more compelling return going forward? (Note, talking about the stock is not the same as talking about the company. A great company is not a good investment if the price is too high.)
  2. Hot hand fallacy: NVIDIA is up 154% today. Past performance is no guarantee of future results. If anything, you might expect returns to be mean reverting, rather than continuing to go parabolic forever.
  3. Recency bias: Forget about the past 12 months. What are the expected returns for the next 10 years? What can we learn from historic situations which were like today?
  4. Confirmation bias: Continually ask yourself: Am I willing and able to change my mind if there was enough evidence? Seek out that evidence and review it objectively.
  5. Hindsight bias: Recognize that there were other outcomes which could have occurred. Keep a journal of your decisions and review them in a year or two. (I publish my annual Investment Themes on my blog and track the results.) This will keep you humble.

Less is More

There will undoubtedly be tough times in the stock market at some point in the future. I’m not here to paint a rosy picture where everything will be easy. Concerns about the elections, economy, debt, etc. have their merit. Still, I don’t know of anyone who has been able to time the market. And people who think the sky is falling have not participated in remarkable gains over the past decade. What has worked is to be a buy and hold, long-term investor. So, here is how we invest in a systematic manner to avoid the cognitive biases and errors:

  1. Index funds. Buying 500 stocks is a lot less risky than buying one stock. I would rather invest in the whole market than bet on one stock. Individual companies can and do go out of business. 80-90% of stock pickers under-perform their benchmark over 5 years or more.
  2. Focus on asset allocation. What is your mix of large vs. small, US stocks vs. international, and stocks vs. bonds? Most of the difference in returns is determined by your asset allocation.
  3. Keep costs, taxes, and trading to an absolute minimum.
  4. Rebalance. Rebalancing is a systematic way to buy stocks when they are cheap and sell them when they become more expensive. Rebalancing helps you maintain your desired level of risk.
  5. Invest as is appropriate for your risk tolerance and time horizon. And then leave it alone, knowing that there are up years and down years in the market.

The news seems to be becoming more and more of a circus. The risk of distraction could scare investors to sell everything and go into cash, or to chase performance on today’s hot stocks. Our recommendation is to ignore the election hype. Educate yourself on cognitive biases and understand that markets have up and down cycles. All of this will lead you to recognize that no one can predict what the markets are going to do over the next 6-12 months. But the markets are so often growing that being out of the market for a year usually proves to be a mistake. And when the market is on a roll, there is the danger of getting too enthusiastic about individual companies and ignoring fundamentals. Avoid making big mistakes and stick with the plan!

Stocks, Bonds, and Risk

Stocks, Bonds, and Risk

I enjoy watching history documentaries, especially about the WWII era. One film shared this quote from a US Army manual:

“…commanders need to balance the tension between protecting the force, and accepting and managing risks that must be taken to accomplish their mission…”

While I am neither soldier nor general, as a portfolio manager, my challenge is to protect client’s assets while accepting and managing the risks that must be taken to achieve their goals, such as retirement. Stocks have been doing very well. In the past week, the S&P 500, NASDAQ, and the Dow have all made new highs. The S&P is up 11 percent, year to date, a fantastic run on top of last year’s great performance. Where are the risks today, and how can we manage the risks to accomplish our mission?

Performance Chasing

Some investors are frustrated that their diversified portfolio is not up as much as the S&P. There is an increasing feeling that stocks are invincible right now and everyone wants to ride the gravy train for as long as they can. Caution is being thrown to the wind as investors seem to be willing to pay any price for certain tech stocks – even if the company is trading for 100 times what they will make this year. The Bull Market appears to be alive and well and so is investors’ performance chasing.

It’s remarkable that we’ve had such high interest rates, and an inverted yield curve, and the economy continues to grow. Maybe the Fed will finally engineer the soft landing that they have been unable to achieve in the past. I hope that happens, but hope is not a good investment rationale.

We remain invested in the stock market, but I hardly think this is the time to become more aggressive. At some point, the high valuations will matter. In the past, when the S&P has traded for 21 times forward earnings (like now), the subsequent years of returns were below average. That should make sense to everyone, just as when the market is cheap, the subsequent returns are usually above average. Both reflect a reversion to the mean.

Bonds Can Get The Job Done

What do today’s stock valuations suggest about forward returns? As of May 15, 2024, the Vanguard Capital Markets Model suggests a 10-year return of US stocks of 4.3%, plus or minus one percent. That is less than half of historical returns, and would be quite a disappointing performance.

And where are bond yields today? The 10-year US Treasury has a yield of 4.5% and we can find 10-year Agency bonds near 6%. Remarkably, the expected return from bonds is now higher than stocks for the next decade. Investors are having a hard time getting their head around this new reality because over the past decade, the S&P 500 (SPY) is up 12% annually, while the Aggregate bond index (AGG) is up only 1.25% a year.

At no point in the last 15 years have bonds looked this good compared to stocks, on a forward looking basis. To investors, bonds look boring and stocks are exciting. However, if you are focused on how to achieve your goals over the next decade, while minimizing the risk of losses to your portfolio, you may benefit from adding more bonds.

What Is Your Mission?

Many of my clients are within five years of retirement or have already retired. For many, our mission is to provide steady growth, spin off some income, and not blow up the portfolio. We are concerned about sequence of returns risk and longevity risk. For clients needing income and withdrawals, bonds and fixed annuities are an excellent choice.

For investors who are in growth mode, there is still a good case for bonds. We should focus on the long-term returns available, with the least amount of volatility. In portfolio management terms, we aim to provide a strong risk-adjusted return, measured by a higher Sharpe Ratio. And for these growth investors, bonds still play a role. Bonds can improve our risk profile and also provide an opportunity for flexibility in the future.

With bonds, you can consolidate your gains while you wait for the stock market to have a correction at some point in the years ahead. With stocks, we may have some years of growth and then the next Bear Market could bring us right back to today’s levels (or maybe even lower). The investor who has bonds (growing by 5%), has a future opportunity to rebalance. We can trim the bonds and buy back stocks when they trade at a lower Price to Earnings ratio (PE). We can be defensive today, while waiting for a better opportunity to be more aggressive.

Don’t Be A Hero

You don’t have to be fully invested in stocks. If you have done a financial plan, you should have an idea of what required return is necessary to accomplish your goals. In many cases, today, bonds can provide the return needed to achieve your objectives. And that reduces the uncertainty of stocks not performing as hoped or as they have historically.

Ideally, investing should be boring. We don’t want to have exciting investments. Our Wealth Management process is focused on protecting your wealth and accepting and managing the risks that must be taken to accomplish your goals. If we can take a path with less risk and more certainty, that is often what we should choose. We look at future expected returns as our guide, rather than recent past performance.

Stocks have had a strong performance and we will continue to invest in a diversified portfolio. We should also point out that while the expected return of US stocks is only 4.3%, Ex-US stocks have an expected return of 7.7%. Opportunities still exist. But for now, bonds offer a compelling return versus an expensive US stock market.

What is a MYGA Annuity

What is a MYGA Annuity?

How a fixed income annuity can provide guaranteed returns and predictable retirement income โ€” especially for retirees in Texas, Arkansas, and nationwide.

A Multi-Year Guaranteed Annuity (MYGA) is a fixed-rate annuity that offers a guaranteed interest rate for a defined period โ€” typically 1 to 10 years โ€” making it a useful tool for retirees seeking predictable income or a safe place to grow cash. MYGAs are popular with conservative investors because they provide certainty in an uncertain market and can complement traditional retirement income sources.


How MYGAs Work (Straightforward Explanation)

A MYGA is an insurance contract in which you pay a lump sum upfront and the insurance company credits a fixed interest rate for a set term. Unlike market-linked investments, a MYGA offers stability โ€” you know the rate and return ahead of time.

Hereโ€™s what this means:

  • You deposit a lump sum (often $5,000+; many competitive products start closer to $20,000+).
  • The annuity earns a guaranteed fixed rate for the term you choose (e.g., 3, 5, or 7 years).
  • Earnings grow tax-deferred until you withdraw them.
  • Upon maturity, you can take the money, renew into a new contract, or elect income payout options.

This makes MYGAs similar to CDs in principle โ€” but with tax deferral and often higher rates.


Why Retirees Like MYGAs (Guaranteed Return and Safety)

MYGAs are especially appealing if you want:

  • Predictable, guaranteed interest income
  • Tax-deferred growth
  • A conservative portion of your retirement portfolio
  • Stability in a low-volatility product
  • Competitive Interest Rates: currently we offer a 5-year MYGA at 5.75%, a full 2% more than a 5-year Treasury Bond

Because returns are fixed, you donโ€™t have to worry about market ups and downs affecting your principal during the contract term. For some retirees, guaranteed income products like MYGAs can complement laddered bonds and cash reserves within a well-structured retirement income planning strategy.


MYGA vs. CDs and Traditional Fixed Accounts

MYGAs are often compared to bank CDs, but there are important differences:

FeatureMYGABank CD
Rate GuaranteeGuaranteed by insurerFDIC/NCUA insured
Tax TreatmentTax-deferred earningsInterest taxed yearly
Income OptionsCan convert to incomeNo lifetime income option
LiquidityLimited, may have surrender chargesEarly withdrawal penalty
FlexibilityOptions at maturityLess flexible
Based on typical product characteristics

MYGAs are backed by insurance companies and state guaranty associations โ€” not FDIC insurance โ€” so the financial strength of the issuer matters.


How MYGAs Can Fit Into Retirement

MYGAs can provide predictable income or serve as a safe allocation within a broader retirement income plan. This can include:

๐Ÿ”น Income Planning

If you want a fixed stream of interest income during early or established retirement, a MYGA can fill the gap between Social Security, pensions, or RMDs.

๐Ÿ”น Laddering for Predictable Cash Flow

Buying MYGAs with staggered maturities ensures you can take money or reinvest at regular intervals โ€” similar to a bond ladder.

๐Ÿ”น Risk Reduction

Because returns are fixed, they provide stability in an otherwise volatile market.

For a deeper look at how MYGAs compare with other retirement tools, see our article on fixed annuities and retirement income strategy.


What You Should Know Before You Buy

MYGAs arenโ€™t right for everyone. Key considerations include:

๐Ÿ”ธ Liquidity and Surrender Charges

MYGAs typically have surrender periods during which withdrawals beyond a penalty-free amount may incur charges. Read the contract carefully.

๐Ÿ”ธ Tax Considerations

Growth is tax deferred, but withdrawals are taxed as ordinary income. If you withdraw before age 59ยฝ, you may face a 10% IRS penalty on earnings.

๐Ÿ”ธ Insurer Strength

Check the insurerโ€™s ratings and the state guaranty association coverage limits.

These features underscore why itโ€™s smart to work with a fiduciary who can match product features to your personal situation.


Why Consider a MYGA With Us (Texas, Arkansas & Nationwide)

If youโ€™re a retiree seeking income โ€” even if youโ€™re not looking for full wealth management โ€” MYGAs can provide competitive fixed income options with market-leading interest rates. Our access to top annuity carriers means clients in Texas, Arkansas, and across the U.S. can secure highly competitive rates and terms that align with their income goals.

We help you:

  • Evaluate options across multiple products and terms
  • Compare surrender periods, riders, and features
  • Make decisions aligned with your risk tolerance and income timeline

MYGAs can be a standalone retirement income solution or a component of a broader plan. Whether you want a safe place for excess cash or a predictable income stream, we can help you explore whether a MYGA fits your needs.

For broader retirement planning that addresses sequence of withdrawals, taxes, and longevity risk, check out our Retirement Income Strategy and our Who We Help pages.


Frequently Asked Questions

What rate can I expect on a MYGA in 2026?

Current competitive MYGA rates are about 5.75% for a 5-year and depend on term and issuer. These rates can be materially higher than traditional CDs or short-term bonds. They also vary quite a bit from insurer to insurer, so it can pay to have an independent agent who can shop around for the best rates and features.

Are MYGAs safe?

MYGAs are backed by insurance companies and state guaranty associations, not the FDIC. Itโ€™s important to review the issuerโ€™s rating and the contract terms.

Can I use a MYGA for retirement income?

Yes. MYGAs can provide predictable income or supplement your other retirement income sources when structured appropriately.

20 Years Financial Planning

20 Years Financial Planning

This month marks 20 years as a financial advisor for me. A lot has changed in that time. When I started, we had to hand-write trade tickets, on blue paper for Buy and salmon for Sell, and fax them to the back office. We would photocopy account applications for our file, fax it in to our custodian, and then mail the original signature.

But a lot has not changed. Markets are still volatile. Timing doesn’t work. Investors still have biases. And good habits build wealth over time.

I am happy to celebrate this milestone, and incredibly grateful for the clients who have trusted me with their finances. I’m excited to start a third decade of service. Markets still fascinate me, and I love getting to help families build and preserve their wealth. One of my early clients passed on years ago, but now I work with their children who are approaching retirement age. And we have accounts for the grandchildren, and we have started 529 college savings accounts for the great-grandchildren. Working with four generations of one family gives you a new perspective about the significance of planning.

Learning the Hard Way

I started buying individual stocks in 1998, right at the end of the tech bubble. I had some profitable investments and some that did poorly. By the time I became an advisor in 2004, I think I had already made every mistake possible with my own investments. You can learn from a book, but the pain of losing your own hard-earned money is a more effective lesson.

After 2000, there were three years of losses in the S&P 500 Index, with the back to back shocks of the tech bubble and then 9/11 in 2001. During this time, I was looking for market inefficiencies and they were still existent back then. There were 50% more stocks than today and stock trading was still done by people on the floor of the NYSE, not on computers.

I would find tiny, small cap regional banks which traded only a couple of thousand shares a day. These stocks had a very wide bid/ask spread. For example, the market might show a bid of $20.00 and an ask of $21.00. If you entered a buy order at the market, you would buy at $21. And if you entered a sell order, you would sell at $20. Sometimes the stock would trade in the middle at $20.50, but large trades could easily move the market, and they would either pay too much to buy or get too little when they sold. Wall Street couldn’t touch these stocks and they were too small to bother.

The spread was often 5%: a $1 spread on a $20 stock. And since the expected return of the whole market was only 10% a year, making 5% on a trade over a day or two seemed pretty attractive. So, I would set a buy limit order at the Bid price of $20 and be the ready buyer for anyone who wanted to sell. And once I had shares, I would set a limit order to sell at the Ask price of $21. When this worked, I could make 3-5% in a day or two. And then once I had sold, I would try to buy back again at $20 and repeat the whole process.

Man Plans, Market Laughs

It worked as planned about half of the time. Sometimes however, the stocks kept on going up. I bought at $20, sold at $21, and then the stock went up to $25. I realized a small gain and then missed out on a big gain. Then I had to decide if I wanted to buy the stock at a much higher price or hope it came back down.

Other times, the stock would drop – I bought at $20 and soon the stock is $18. If I had 100 shares at $20, I would buy another 100 shares at $18 and lower my average cost to $19. Now, I only need the stock to get back to $19 for me to sell and break even. I would set a limit order to sell at $19 and hope I can get my money back.

If the stock would recover to $19, I’d sell. But the stock might then go to $22 and I would again have missed out on gains. Other times, the stock would continue to fall to $16, and I would buy more shares at $16 to try to average down further. But I was only increasing my losses.

At the end of the year, I’d have a lot of successful, but small trades where I had gains of 3-5%. And I would have a couple of large losses of 20%-30%, which I had magnified by buying more shares.

Lessons

Did my trading work? Sort of. I had a profit. In fact, in 2003, I was up 35% in spite of being in cash for a large number of days that year. But here are some of the things I learned:

  1. I made 35% in 2003, but the S&P 600 small cap index was up 37% that year. All the hours I spent researching stocks and following the market daily were not productive. I would have been better off using an index fund and spending my time elsewhere. Everyone thinks they’re a genius when the market is going up.
  2. Costs and Taxes matter. All my gains were short-term capital gains, taxed as ordinary income. With an index fund, I could hold for longer and eventually get long-term capital gains tax at 15%. Back in 2003, each trade cost $19.99 and I paid thousands in commissions that year.
  3. No one can predict individual stocks and speculation will humble you. Investing is better than trading: diversify and remain a buy and hold owner. Prices going up and down are noise.
  4. Let your winners run and harvest your losses. Humans are wired to do the opposite. I cut my gains short and doubled down on the losers. This comes from two behavioral biases: loss aversion and anchoring bias. I was fixated on shares getting back to even.
  5. Simple is usually more effective than complex. Focus on the long-term, not the short-term.

Today, markets are more liquid and most bid/ask spreads today are 1-5 cents. This is much better for investors. In spite of the prevalence of index funds, however, there is still a lot of speculation on individual stocks. Every morning, I read about stocks which were up 4% or down 7% in the previous day. It’s interesting, but not an opportunity. And of course, I have written many times about how managed funds under-perform index funds. I understand the allure of picking individual stocks, but today I have realized that stock picking is less beneficial than asset allocation. Investors don’t become wealthy because of stock picking, but through saving and time in the market.

The More Things Change

The past 20 years have seen some remarkable market events. The Global Financial Crisis of 2008-2009. The Lost Decade of stocks. Zero Interest Rate Policy. Coronavirus and then 9% inflation. Everything seems to have been a “never-seen-before” moment. And yet somehow, what has always worked, still works. I look back to every low point and think, wow, that was such a great buying opportunity!

I’m looking forward to the next 20 years of financial planning. I have no idea what we will see. How will we fix Social Security and Medicare? What is going to happen with the global debt levels? Will inflation remain elevated? Will AI save the economy and create a productivity boom, or destroy jobs?

What the last 20 years have reinforced for me is that we don’t have to know what is going to happen. We save, invest, diversify, rebalance, and keep costs and taxes low. That formula has built wealth for generations. We will continue to learn and improve, but the foundation of the financial planning process is timeless. We are awash in information today, but in spite of all the available knowledge, wisdom still requires experience.

My three month old daughter is asleep in the next room as I write this. Having a child is the ultimate form of optimism. We must have confidence, patience, and faith in a positive outcome. Along the way, there will be ups and downs, but ultimately growth is headed in the right direction. Our years are determined by our days. If we manage our days right (and weeks and months), the years take care of themselves. But we have to think about the years, when deciding how we use our days.

And so it is with money. I remain very optimistic about the work we do for clients and about the remarkable opportunity for Americans to achieve financial independence. There has never been a better time to be alive. Thank you to everyone I have met along the way for a great 20 years!

Performance Chasing Versus Diversification

Performance Chasing Versus Diversification – A Retiree-Focused Perspective

Updated for 2026 โ€” Planning-first language for retirees and pre-retirees

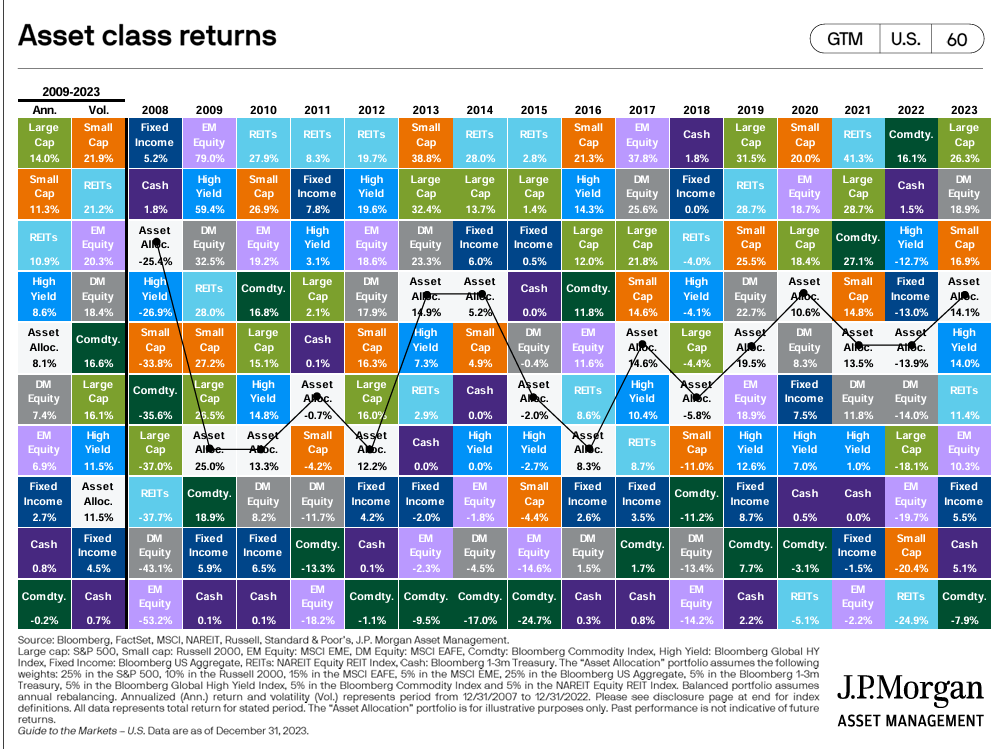
Many retirees and those approaching retirement find themselves checking account statements after a strong year in certain market segments โ€” especially when one area (like large growth stocks) outperforms nearly everything else. The chart below, sourced from J.P. Morgan, vividly illustrates how the top-performing investment categories change from year to year (2008โ€“2023), including U.S. stocks, developed and emerging markets, bonds, real estate, commodities, and cash.

Why Performance Chasing Is Especially Dangerous for Retirement Investors

When a particular category outperforms one year โ€” and especially in hindsight when it โ€œlooks obviousโ€ โ€” it can be tempting to shift away from a broadly diversified portfolio into what just worked best. This behavior is known as performance chasing:

  • It treats recent winners as future winners, even though history shows that last yearโ€™s top performer often underperforms in subsequent years.
  • It increases the risk of selling diversified holdings after declines and buying into areas that have already risen substantially.

For retirees and pre-retirees, the stakes are higher than for many accumulators. Changing allocations based on recent performance can increase the risk of sequence-of-returns losses โ€” when poor returns early in retirement can have an outsized impact on long-term spending sustainability.

Contrast this with diversification, where owning multiple asset categories โ€” even ones that lag in the short term โ€” tends to smooth returns and lower overall risk over the long run.


Past Performance Is Not Predictive โ€” Especially Near Retirement

Itโ€™s common for investors to see a chart like the one above and think:

โ€œI should sell my diversified portfolio and buy the top performer from last year.โ€

This is performance chasing โ€” abandoning a long-term, diversified strategy because of recency bias. Over short spans, certain assets may shine, but over time, no single category consistently outperforms.

Diversified portfolios are structured so that gains in some areas weathers declines in others. While this means you wonโ€™t always be in the leading category each year, it also reduces the risk that you are overly concentrated in one bucket โ€” particularly important when you are drawing down assets in retirement.


Valuations Matter โ€” But Timing the Market Doesnโ€™t Work

Behavioral biases often cause investors to equate strong recent results with future prospects. But valuation-based approaches focus on expected future returns rather than trailing returns โ€” recognizing that:

  • Stocks or sectors that have outperformed may trade at higher valuations and offer lower expected future returns;
  • Investments that have lagged may be cheaper and offer relatively better expected returns.

For retirees, valuation focus โ‰  market timing; it means aligning your portfolio with a disciplined, cost-effective, diversified strategy that doesnโ€™t shift based on the latest hot sectors.


Reversion to the Mean โ€” A Long-Term Reality

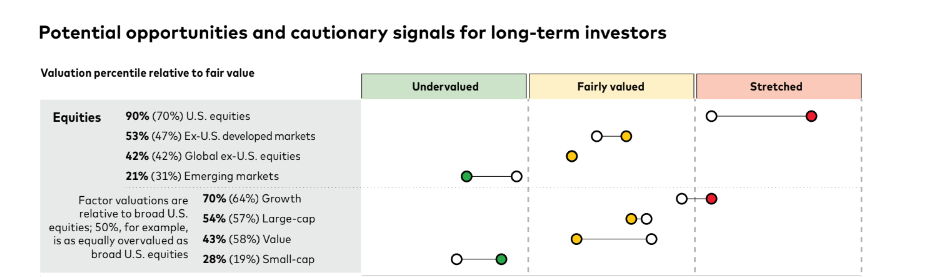
Over the long run, markets tend to drift back toward average performance levels. The original Vanguard projected return chart (unchanged here) shows this principle: asset classes with higher valuations often have lower expected future returns, while those with lower valuations may have higher expected returns.

Short-term leadership does not reliably predict long-term outcomes. A diversified portfolio owns multiple asset classes so that you benefit from broad market growth without betting on a single segment.

Why Diversification Matters for Retirees

For retirees and those preparing for retirement:

  • Diversification reduces portfolio volatility, which matters when youโ€™re making regular withdrawals.
  • Diversification helps manage sequence-of-returns risk, the risk that early poor returns deplete your portfolio faster.
  • A diversified approach is more likely to deliver smooth, reliable outcomes that align with spending needs, not headlines.

If you want a primer on how diversified income flows and drawdown strategies interact in retirement, see our Retirement Income Planning Hub.

For a deeper look at the role diversification plays alongside tax planning and income sequencing, see our Retirement Tax Planning articles.


Related Retiree-Focused Content


If youโ€™re nearing retirement or already retired, chasing last yearโ€™s top performer can undermine your long-term financial security. Staying diversified and disciplined helps align your investment approach with your income needs and risk tolerance. If youโ€™d like a planning-first discussion about how diversification fits with your broader retirement strategy, youโ€™re welcome to Request an Introductory Conversation.

Investment Themes for 2024

Investment Themes for 2024

Each year, I rethink our portfolio allocations and today I am sharing our Investment Themes for 2024. We don’t time the market, nor do we try to predict how the market will perform. I think this is not only impossible, but also likely to cause more harm than good. We remain globally diversified, use index funds, and maintain a buy and hold philosophy. We have a target asset allocation for each investor and rebalance positions when they drift from our targets.

But that doesn’t mean we are completely passive. No, each year we slightly adjust our portfolio models in two ways. First, we look at current valuations and expected long-term returns (typically 10 years). With this information we add weight to the Core categories which have better valuations and expected returns. And we reduce categories which might be overvalued and have lower expected returns. This is forward looking, rather than looking back at past performance.

The second adjustment we make to portfolios is to annually evaluate Alternative holdings for inclusion in our models. Alternative, or satellite, positions are smaller, more niche investments, which I don’t think merit permanent inclusion as a Core position, but may be appropriate at certain times. We will describe our alternative positions more below.

2023, Better Than Expected

2023 ended up being a great year in the stock market, with the S&P 500 up 24%. This was a shocker. A year ago, 85% of economists were predicting a recession in 2023. But it never happened and the consensus was wrong. A year ago, I wrote that in spite of the calls for recession, the bad news may have already been priced into stocks and that we would remain invested. You can read my Investment Themes for 2023 here. And here are links for my 2022 Themes and 2021 Themes.

Although the S&P 500 and NASDAQ had a great year in 2023, it was aften a frustrating year for investors. Market breadth was poor and performance was concentrated in a fairly small number of Growth and Technology stocks. 2/3 of stocks did worse than the S&P 500 average. And other categories, such as International, Small Cap, or Value, lagged the Mega-Cap names.

It was also a strange year for bond investors. Rising interest rates pushed down the prices of bonds, and detracted from their performance. So, unfortunately, bonds did not add much to the bottom line in 2023. But the flip side of rising rates is that we have purchased very attractive yields which we will hold and profit from for years to come.

Economic Expectations and Stocks

Markets had a great 2023 and the US avoided a recession. But I am afraid this is no guarantee that the economy is in the clear now. The Federal Reserve raised interest rates and has managed to bring inflation down to 3% without damaging the economy or causing higher unemployment – yet. In the past, such aggressive tightening by the Fed has led to a recession. Will they finally be able to engineer a “soft landing” and not cause a recession? The strength and resilience of the US economy in 2023 is truly the envy of the world.

Unfortunately, I think we need to remain cautious and recognize that it is possible that 2023 only postponed a slowdown rather than avoided one altogether. Today the consensus is that the Fed is done raising rates and will start cutting interest rates later in 2024 once inflation is closer to their 2% target. But none of this is a guarantee that a recession is off the table. 2024 could be another volatile year.

And where are we in terms of valuations? US stock earnings grew by 3% in 2023, but stock prices went up 24%. That means that now US stocks are even more overpriced and the expected returns going forward are lower. The returns of 2023 are surprising because they are unwarranted. US growth stocks have become more expensive, not better.

Looking at our core stock categories today, we have the same themes, but only more so. US Value is cheaper than Growth and has a higher expected return. International has a higher expected return than US. Small Cap is attractive relative to large cap. Emerging Markets have strong growth potential. We were already tilted towards Value and International at the start of the year, and this was early. US Growth outperformed in 2023, but the case for Value and International has only grown stronger and more compelling. Our outlook is for more than one year at a time, and sometimes that means we have to remain patient to see a reversion to the mean.

For 2024, we will make a small addition to our International funds, from our US Midcap funds. We use Index exchange traded funds (ETFs) for our Core positions.

Source: Vanguard Economic and Market Outlook for 2024, published December 2023

Interest Rates and Bonds

Interest rates rose steadily through October of 2023. We continued to buy individual Investment Grade bonds. Our core bond holdings are laddered from 1-5 years and we generally hold to maturity and reinvest. 2023 offered the best yields available in the past 15 years. We wanted to lock in some of these yields for longer, and so we had extended duration in 2023, adding some longer term 10-15 year bonds.

Interest rates peaked in October with the 10-year Treasury briefly touching 5%. Since then, the 10-year has fallen to 3.9%, a massive move in a very short period of time. (This high demand for bonds, and inverted yield curve, is a red flag for stocks and the economy.) We’ve seen a lot of Agency bonds getting called and refinanced to lower rates. And so it is possible we have seen the peak interest rates for this cycle already.

I am glad we were buying when we did and that we extended duration. Today, it is less attractive to buy longer bonds, and our purchases in 2024 will return to being on the shorter end of the yield curve. We will not be adding to bond holdings in 2024, just aiming to maintain our 1-5 year ladder as bonds mature or are called. But there is a good rationale for holding bonds. Real yields (after inflation) are attractive. We have purchased yields which are comparable to the expected 10-year return of US stocks. And so, the 60/40 portfolio at the start of 2024 looks better than it has in years. And if we have a Bear Market in stocks in the next couple of years, the bonds will be defensive and give us the opportunity to rebalance and buy stocks when (not if) they drop.

Alternatives

Bond yields have been so good in 2023 that the appeal of alternatives is less. Why take on a volatile, complex investment if T-Bills are yielding over 5%? We will not be adding to any alternative or satellite categories in our 2024 models. We have several existing positions, which we will continue to hold.

TIPS (Treasury Inflation Protected Securities) were added in 2022 and they have given us a good inflation hedge. Our largest TIPS holding will mature in 2027 and at this point the plan is to hold to maturity. Inflation is less of a concern now, but our TIPS are still paying a decent yield.

Last year, we trimmed our holdings in Preferred Stocks, which sold off as interest rates rose. Today, they have started to bounce back and offer yields over 6% while often trading at a 30% discount to their Par value. The current 6-8% cash dividends we receive from Preferreds is above the expected return of common stocks. I’m happy to have that cash flow for retirees or to have cash to reinvest throughout the year. There is some potential for price appreciation in the next rate cutting cycle, but I am happy to hold these for the dividends and ignore any price volatility.

Our third satellite holding is a small position in Emerging Markets bonds. We use a Vanguard fund and ETF, which offer low cost diversified access to this high yield sector. I’ve seen that this category often bounces back well after a difficult year. And after being down in 2022, our fund was up nearly 14% in 2023. The fund begins 2024 with a 7% yield.

Staying On Course

We look each year to make some minor changes in our allocations, and communicate these ideas in our “Themes” letter. But, I think the real key for investors is to think long-term and be willing and able to stick with the process. There will inevitably be ups and downs and the markets often surprise us and don’t do what we expect. We have done well to stick to the basics: Don’t try to outsmart the market. Buy and Hold index funds. Keeps costs and taxes to a minimum.

If you have questions about our Investment Themes for 2024, please reach out. Even with these themes, we still have different investment models for our clients’ individual needs, risk tolerance, and time horizon. 2023 was a year full of surprises, and we will have to see what is in store for 2024!