


Last October, electric car maker Tesla introduced self-driving features into its cars overnight, with a software update installed via wifi. In January, General Motors invested $500 million into car-service Lyft with plans to begin testing driver-less car services for actual customers in one year. Google, Apple, Ford, Toyota and others are racing to produce self-driving cars and we are very, very close to seeing this incredible technology become a reality. Could your next car be an Apple iCar?
Technological change is nothing new, but we may be on the verge of seeing the rate of change increase dramatically, with significant implications for individuals and the economy as a whole. Some of these changes are fairly easy to predict, but there will be secondary and tertiary impacts which will be much more difficult to imagine. And while the changes will be net positive for society, cost savings often come about when jobs which are no long necessary become eliminated.
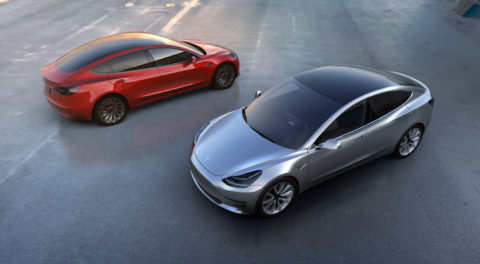
Self-driving cars will be much safer, virtually eliminating accidents from distracted driving, driver error, fatigue, or drunk driving. Driver-less trucks and taxis will gradually replace drivers, reducing transportation costs. Families will no longer need two, three, or four cars, and many will forgo car ownership altogether, being able to summon a vehicle for the relatively few minutes a day they require transportation. Your newborn child or grandchild may never even have a driver’s license!
Speeding tickets and traffic infractions will decline, creating budget gaps for cities who previously enjoyed significant revenue. Warren Buffett called self-driving cars a “real threat to insurers” like GEICO, which derive substantial revenue from car insurance. As insurance premiums fall for safer driver-less cars, you can expect that premiums for the remaining human drivers will skyrocket as they will quickly become the high risk vehicles on the road.
There are so many positives about driver-less cars that will make our lives better. However, if you are a truck driver, own an auto body shop, work for an insurance company or emergency room, you should expect less demand for your services, reduced revenue, and loss of jobs across your industry. For those individuals, the driver-less car will have the same effect as Henry Ford’s Model T had on carriage makers and buggy whip manufacturers a hundred years ago.
Innovation is great for society and the economy, but can come at a high cost for those individuals who get left behind. Last month, I wrote about the benefits of working until age 70. The greatest challenge for many people will not be their ability or willingness to work until 70, but just keeping their job for that long.
Last year, I met an individual who lost his job of 30 years at age 57 when his employer closed. He wanted to keep working and was not prepared, financially or emotionally, for retirement. However, his skill set was decades out of date. He wanted to hold out for his old salary and was unwilling to relocate or consider jobs that were not near. He looked for a job for three years before officially declaring himself retired at age 60. Now, he has no choice but to start Social Security at age 62 and lock-in a greatly reduced benefit. His retirement will be quite tight, which wouldn’t have been the case had he been able to work and save for another 8-10 years as he had originally planned.
To work to age 70, most folks will have several different careers and will need to continually educate themselves and possibly even retrain entirely if their profession is going to be impacted by innovations such as the driver-less car. Education will become life-long, instead of something which is completed and left behind in your early twenties. There is no doubt that it is a challenge to be a job seeker in your 50’s or 60’s, which is why the best thing for those at risk of job loss is to keep your skills and certifications fresh and to change jobs before you find yourself unemployed.
The two most valuable companies in the world today are Apple and Google, each with a valuation of roughly $500 Billion. That shows the remarkable economic opportunity behind innovation. And Google created that value in less than 18 years! As investors, it’s easy to recognize the growth achieved from new technology. For the sake of your individual financial plan, however, you first need to make sure that you will have an income to save and invest! Consider what are the risks to your career before those risks become a reality.

")


")

